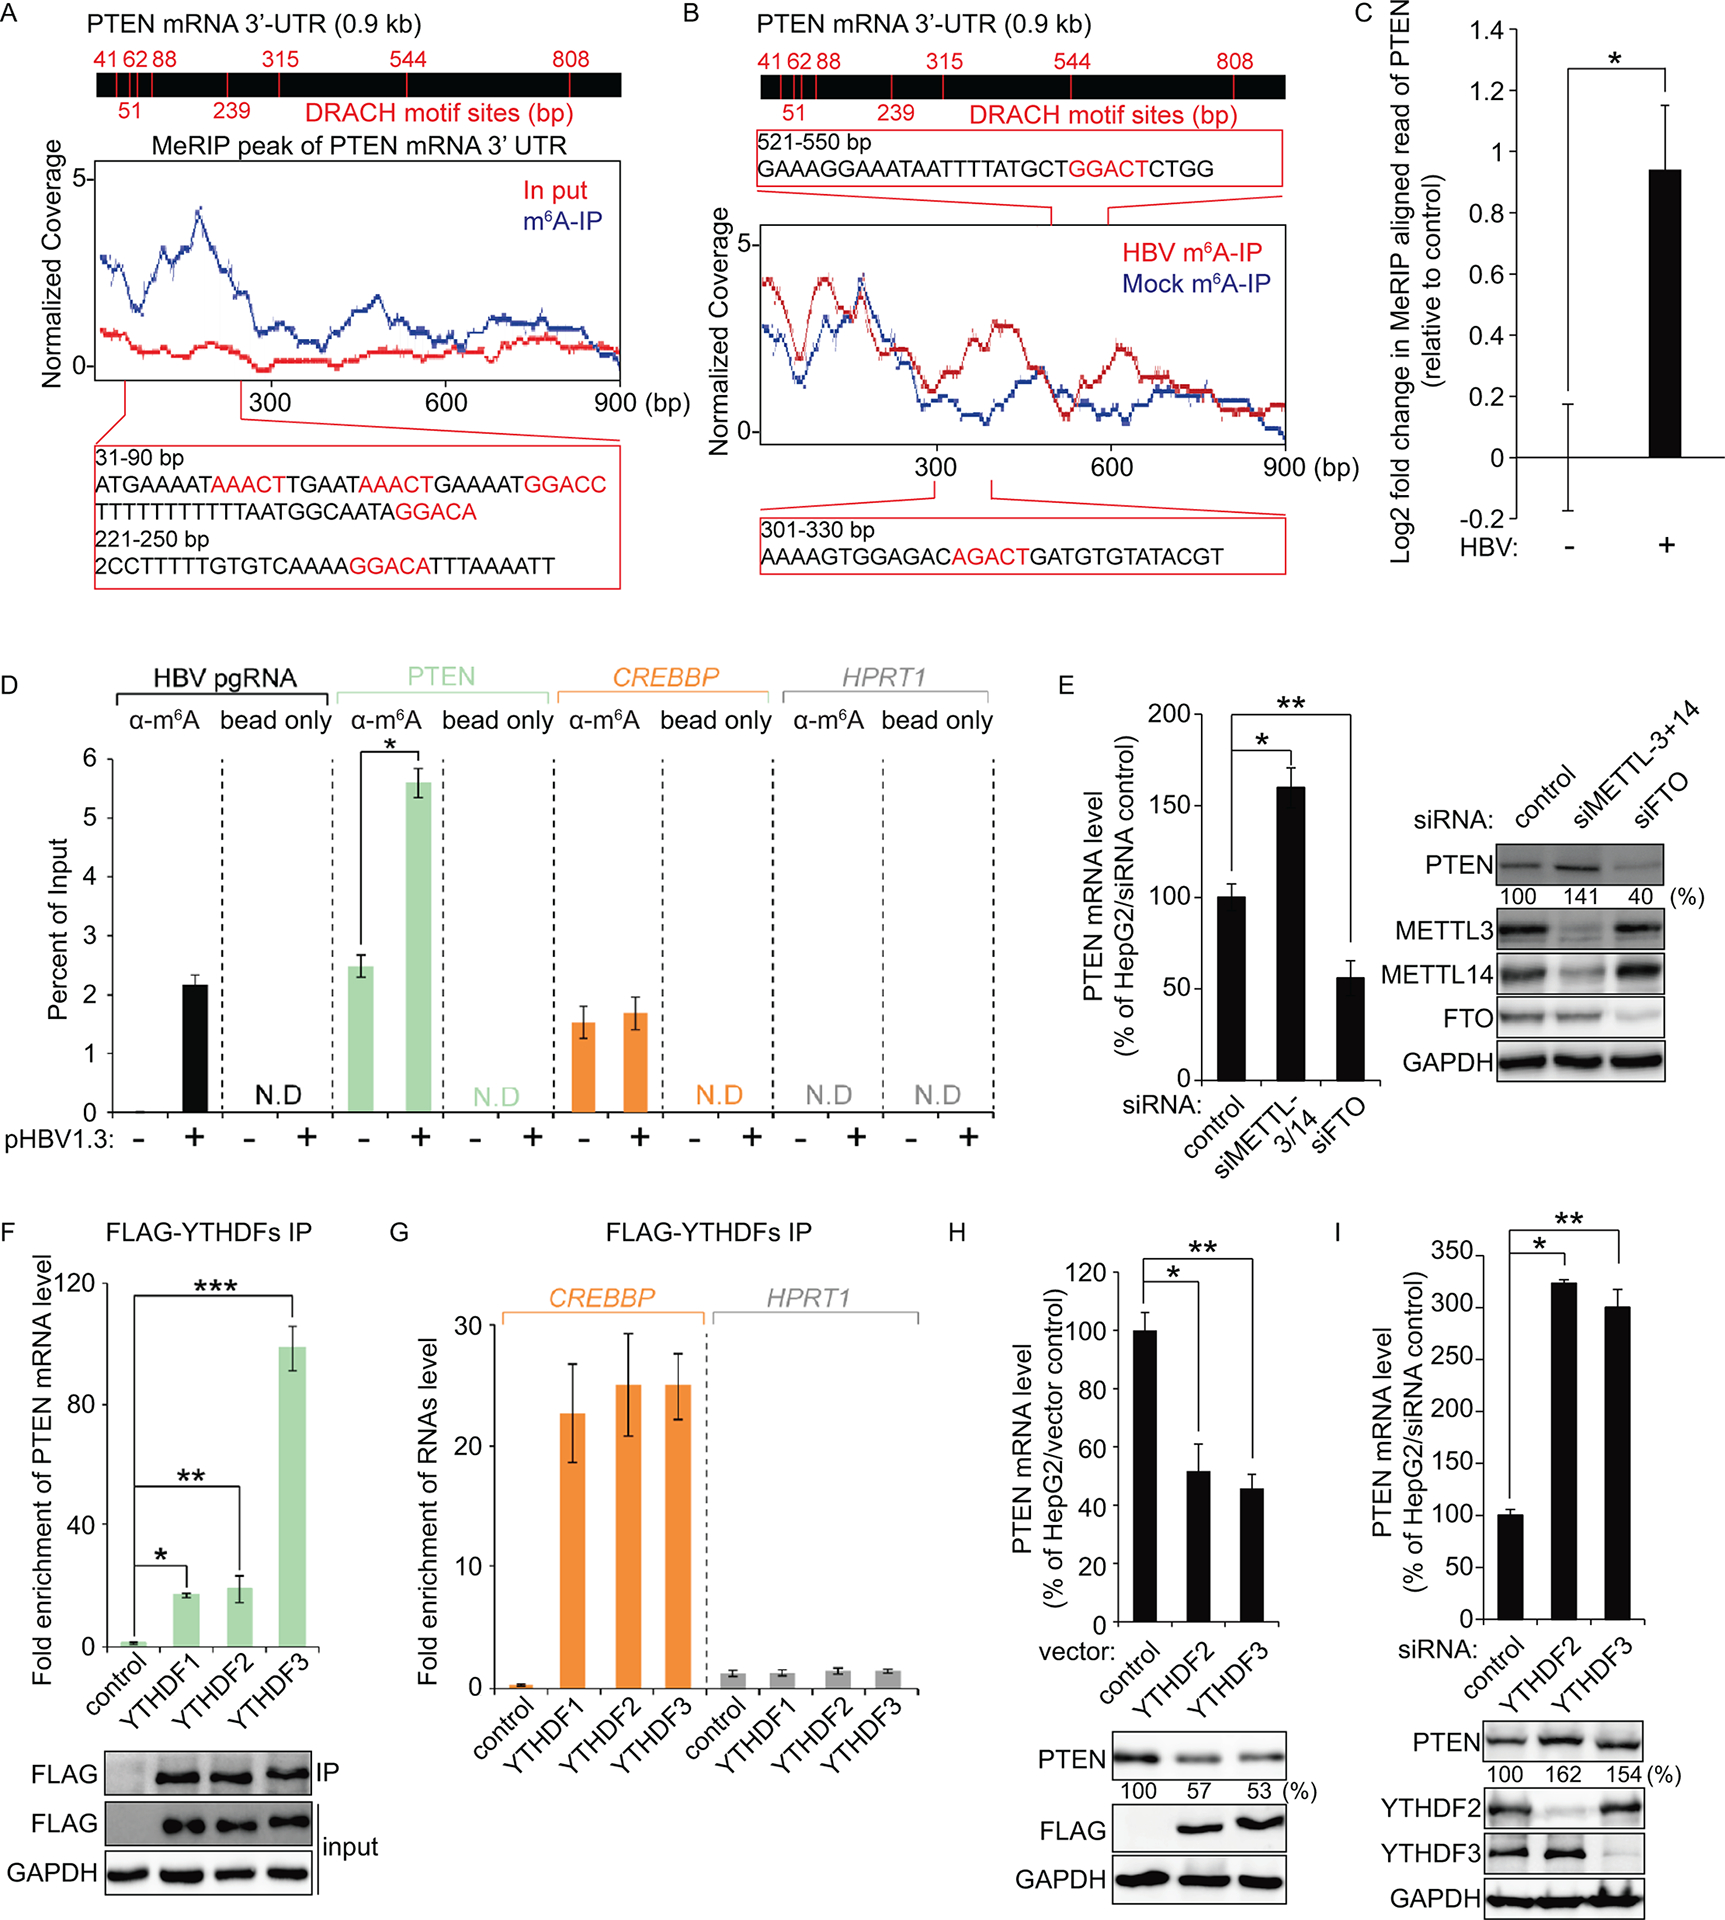
Fig 1.

PTEN 3′-UTR contains the m6A modification and its modification is regulated by HBV transfection. (A and B) Map of m6A-binding sites in the PTEN 3′-UTR region by MeRIP-seq (representative of three independent samples) from HBV expressing HepG2 cells. Blue coverage, normalized to the total number of reads mapping to the PTEN mRNA for each experiment, is in blue for MeRIP-seq and red for input MeRIP-seq. Eight DRACH motif sites were identified in PTEN 3′-UTR. Several m6A peaks were analyzed after normalizing for coverage. The Inset presents bp 31–90 and 221–250 of PTEN 3′-UTR region, with the m6A sites highlighted by red text (A). Read coverage, normalized to the total number of reads mapping to the PTEN mRNA for each experiment, is in red for HBV expressing cells RNA-seq and in blue for control cells RNA-seq. The Inset presents bp 301–330 and 521–550 of PTEN 3′-UTR region, with the m6A sites in HBV expressing cells highlighted by red text (B). (C) Fold change (log2) of the MeRIP reads of PTEN mRNA in the HBV expressing cells compared with the control HepG2 cells. Plotted in (C) are the relative reads number of PTEN (mean ± SD estimated from three independent samples). *P = 0.0058 (D) MeRIP-qRT-PCR of m6A modified HBV transcripts and PTEN mRNA from total RNA extracted from HepG2 cells transfected with HBV 1.3-mer plasmid. CREBBP and HPRT1 serve as positive and negative controls, respectively. *P = 0.00029 (E) Relative PTEN mRNA level in HepG2 cells transfected with siMETTL3 + 14 or siFTO at 2 days post-transfection. PTEN protein expression was assessed by immunoblotting. *P = 0.0015 ** P = 0.0035 (F) Enrichment of PTEN mRNA following immunoprecipitation of FLAG-tagged YTHDFs from extracts of HepG2 cells after 48 h transfection. Enriched PTEN mRNA was quantified by qRT-PCR as the percentage of input and graphed as fold enrichment relative to control. Immunoblot analysis of FLAG-YTHDFs in the input and IP is shown on bottom panels. *P = 0.00004 ** P = 0.0021 *** P = 0.00022 (G) RNA immunoprecipitation from FLAG-YTHDFs transfected HepG2 cells using anti-FLAG antibody, with qRT-PCR analysis of CREBBP and HPRT1 were quantified as relative enrichment RNA level. (H and I) HepG2 cells were transfected with FLAG-YTHDF2/3 or siRNAs of YTHDF2/3. After 48 h, cells were harvested to assess expression levels of PTEN mRNA and proteins levels (*P = 0.0015 ** P = 0.00013; E, *P = 0.00024 ** P = 0.0065; F). In (C – I), the error bars are the standard deviations of three independent experiments, each involving triplicate assays. Statistical significance of the difference between groups was determined via an unpaired Student’s t-test.
