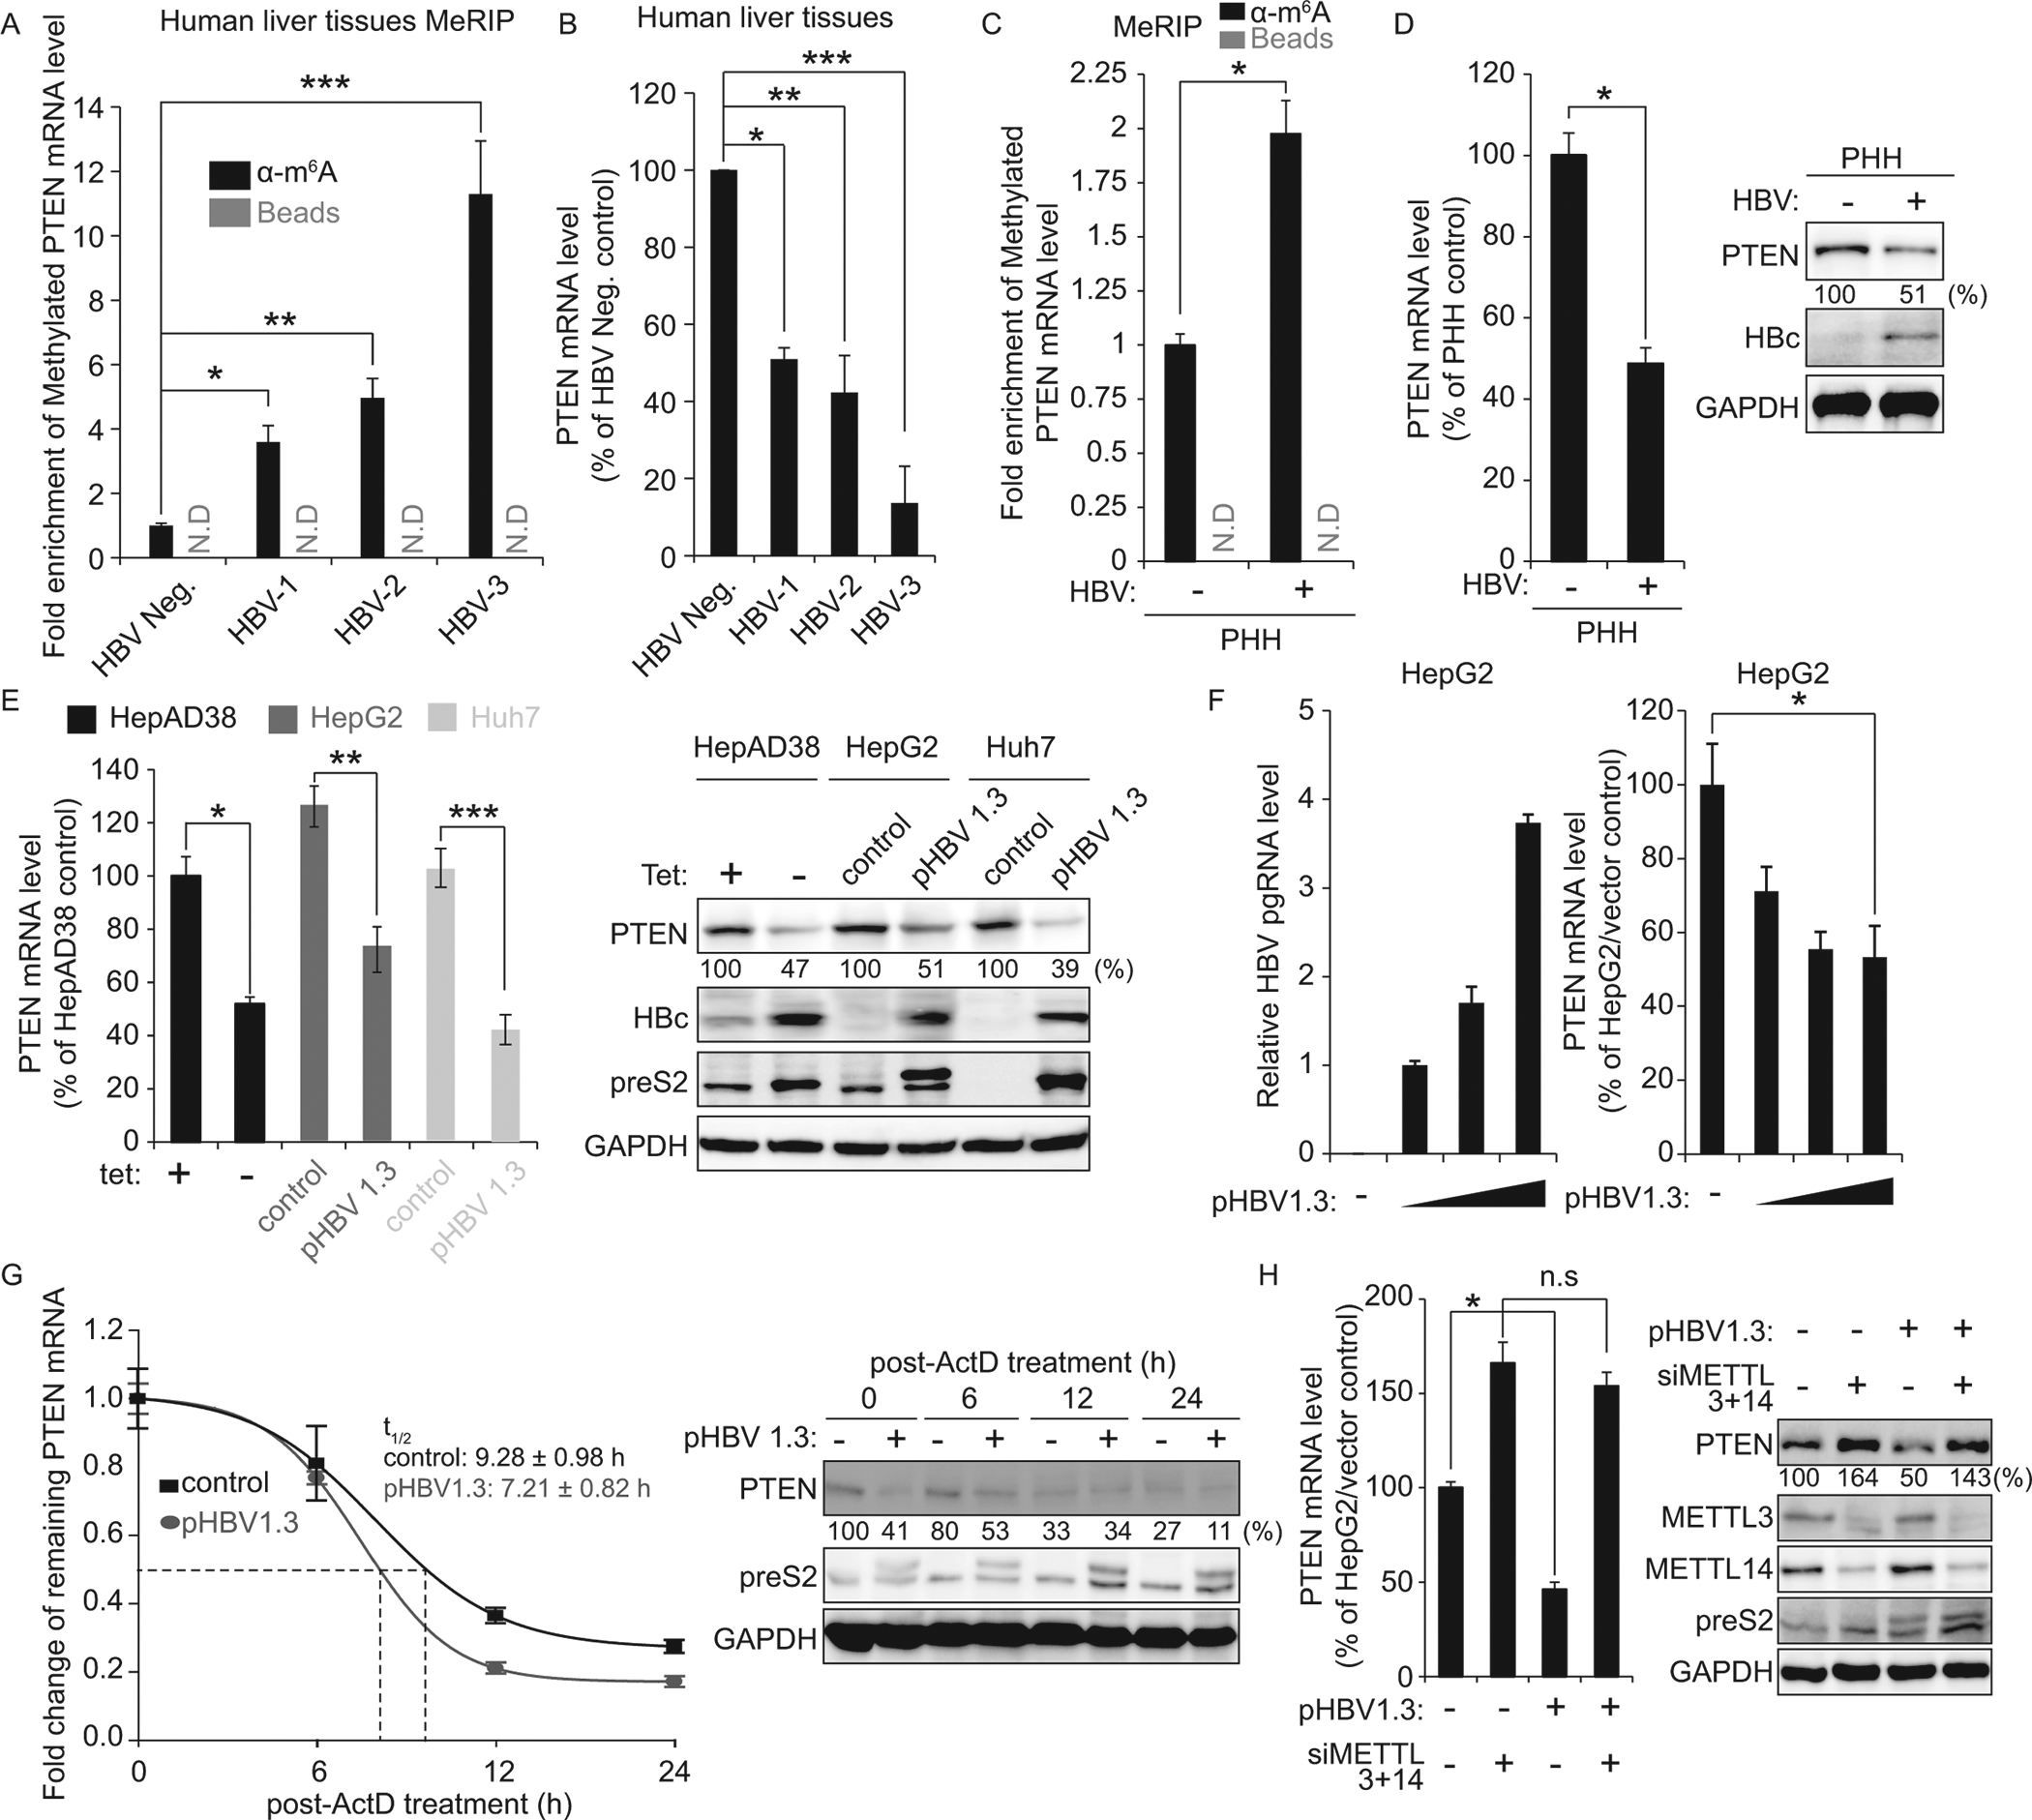
Fig 2.

HBV reduces PTEN mRNA stability by regulating m6A modification. (A) MeRIP-qRT-PCR analysis of total RNA from chronic-HBV patients (HBV-1 to HBV-3) and healthy control (HBV-negative) using primers specific to PTEN mRNA. RNA was immunoprecipitated with anti-m6A antibody and eluted RNA was quantified by qRT-PCR. *P = 0.00051 ** P = 0.00043 *** P = 0.0011 (B) qRT-PCR quantification of PTEN mRNA levels normalized to GAPDH RNA in liver biopsies in (A). *P = 0.0036 ** P = 0.0061 *** P = 0.00027 (C and D) PHH were infected with HBV. After 72 h, PHH were harvested to assess expression levels of m6A modified PTEN mRNA, PTEN mRNA and protein (*P = 0.0047; C, *P = 0.0025; D). (E) Relative PTEN mRNA levels in HBV-induced HepAD38 and hepatoma cell lines (HepG2 and Huh7) transfected with HBV 1.3-mer plasmid at 2 days post-transfection. Shown in the right panels are the results of immunoblotting analysis for the indicated proteins in cell lysates. *P = 0.0044 **P = 0.0054 ***P = 0.0059 (F) HepG2 cells were transfected with increase amounts of HBV 1.3-mer (1, 5, and 10 μg). After 48 h, cells were harvested to assess expression levels of PTEN mRNA. *P = 0.00387 (G) qRT-PCR analysis of PTEN mRNA relative to GAPDH in the HBV 1.3-mer expressing HepG2 cells. The HBV 1.3-mer transfected HepG2 cells were treated with Actinomycin D at 24 h post-transfection. Cells were harvested at 0, 6, 12, and 24 h post Actinomycin D treatment and relative levels of remaining PTEN mRNA and proteins were analyzed. (H) The HBV 1.3-mer transfected HepG2 cells were depleted for METTL3 and 14 by siRNAs. After 48 h, total RNA and lysates were extracted to assess expression levels of PTEN mRNA and protein. *P = 0.0039 In (C – H), the error bars are the standard deviations of three independent experiments, each involving triplicate assays. P values were calculated using an unpaired t-test. n.s, not significant by unpaired Student’s t-test.
