
FIGURE 3. Primary NK cells adhere to and migrate on cell-free matrices.
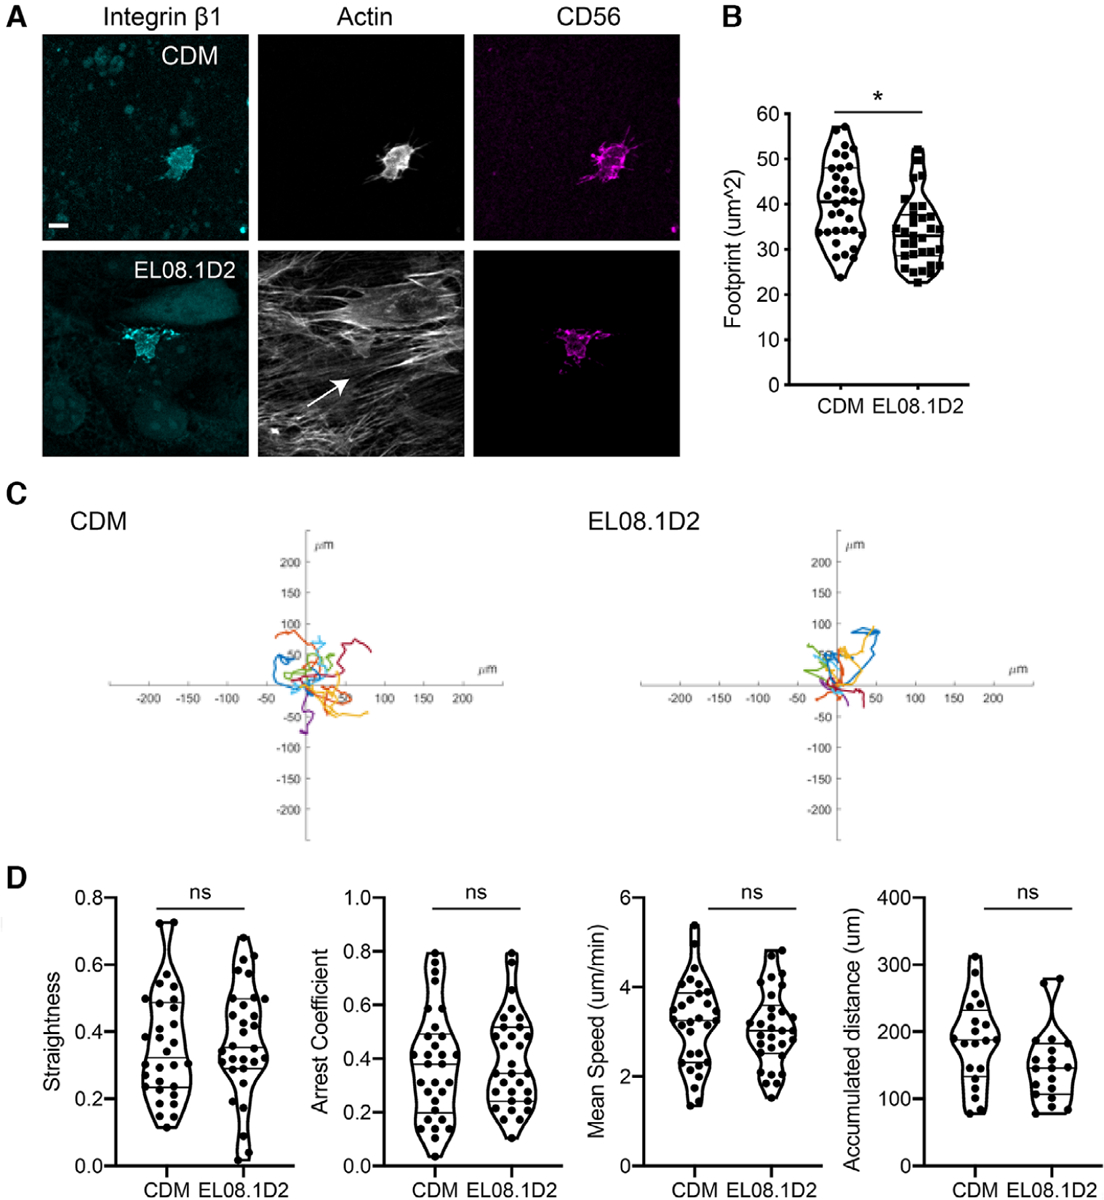
Freshly isolated primary NK cells were adhered to either EL08.1D2 or cell-derived matrix. (A) cells were co-incubated for 30 min and then fixed and immunostained as indicated followed by confocal microscopy. Images show maximum intensity projection of z-stacks. Scale bar = 10 μm. (B) Quantification of cell area in each condition. Error bars indicate sd. Means with significant differences were determined by Mann-Whitney U test (*P < 0.05). (C) Primary NK cells were isolated from peripheral blood and seeded on substrates and imaged every 2 min. Cell migration was tracked following image acquisition. Rose plots of primary NK cell tracks in each condition are shown. (D) Cells were tracked and migratory parameters were measured. n = 19, 20 cells from 2 individual healthy donors. Means were analyzed by Mann-Whitney test