
FIGURE 5. NKDIs have comparable migration on CDM and EL08.1D2.
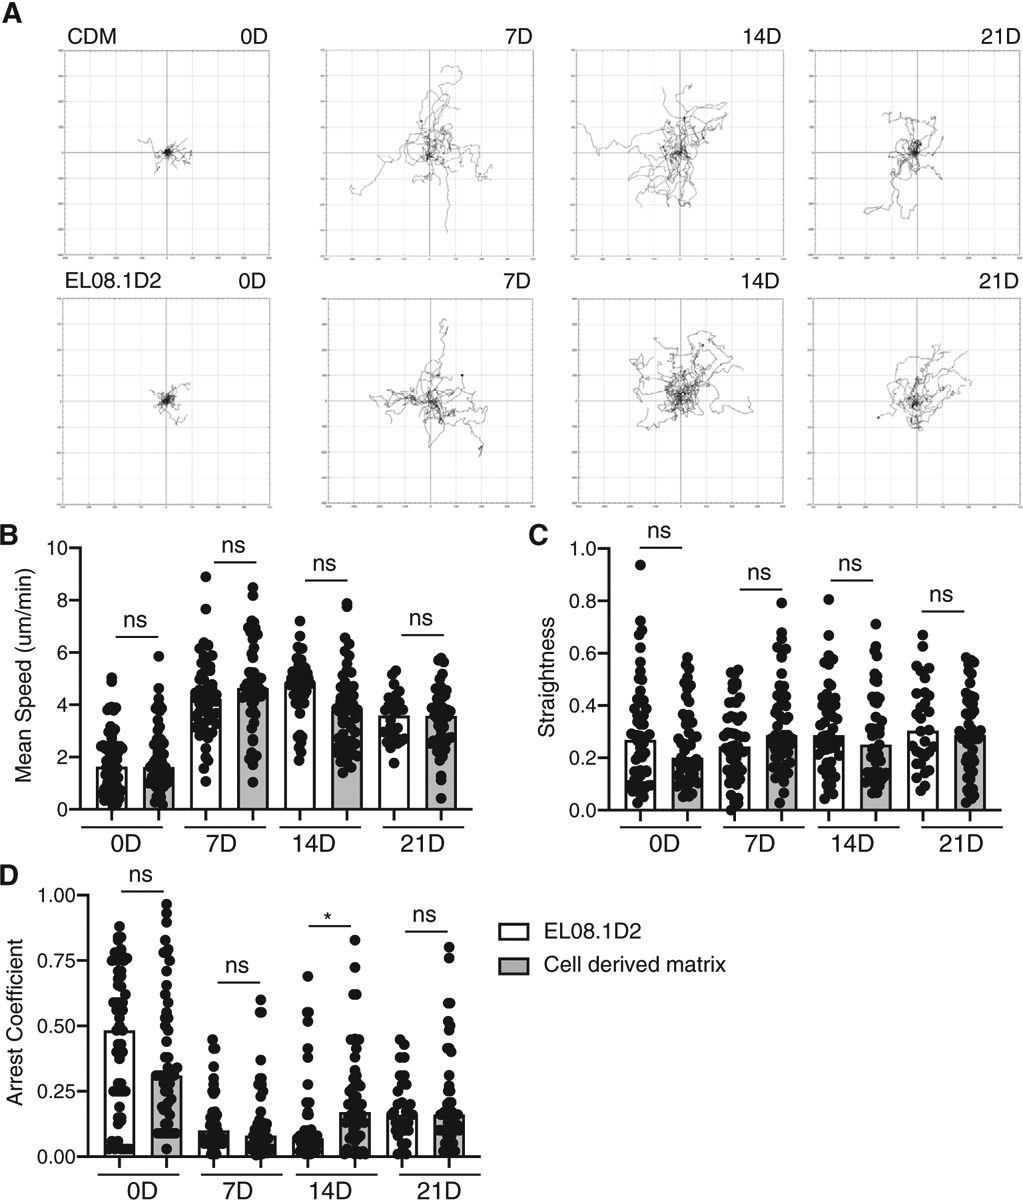
CD34+ HSCs were isolated from peripheral blood and seeded on CDM or EL08.1D2 stroma. Cell migration was imaged every 2 min by phase contrast imaging in an in-incubator imaging system. (A) Representative plots of cell tracks on CDM and EL08.1D2 at each week. The mean speed (B), straightness (C), and arrest coefficient (D) of cell tracks was determined. Error bars indicate sd. Means with significant differences were determined by ordinary 1-way ANOVA with Tukey’s multiple comparison test (*P < 0.05). n = 30–55 tracks pooled from 3 biological replicates