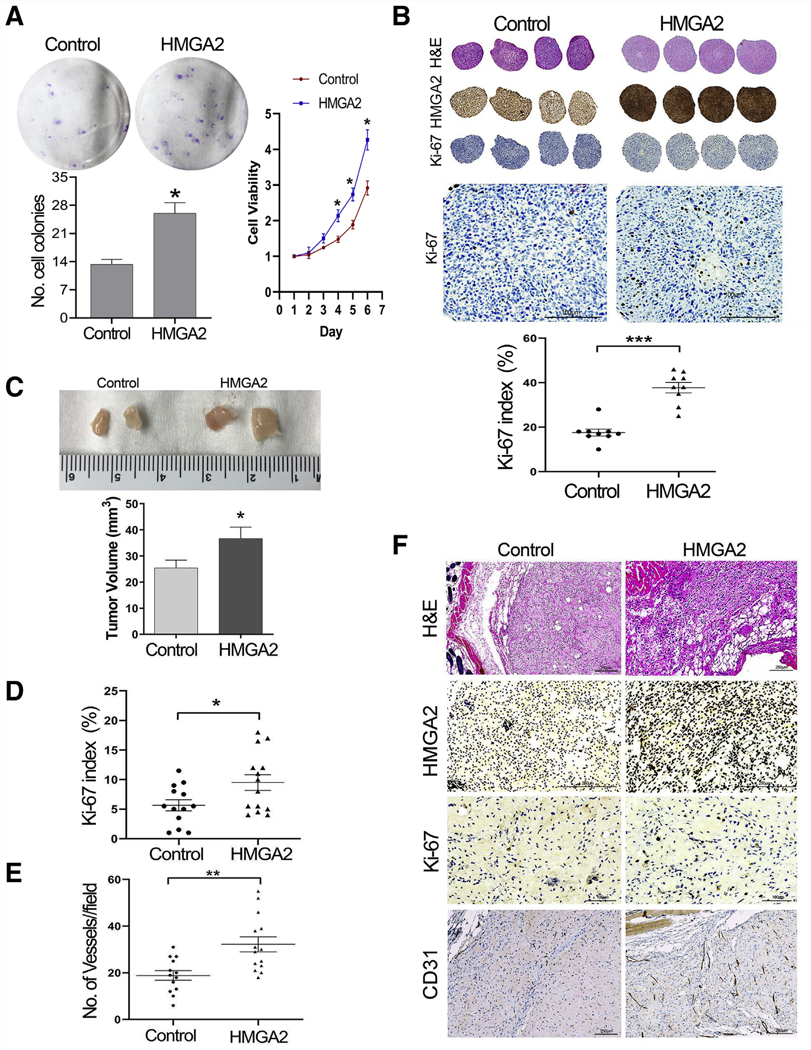
FIGURE 4.

Colony formation, WST-1 assay, spherical culture, and mouse xenografts of myometrial cells with HMGA2 overexpression. (A) Colony formation (left) and WST-1 (right) in MM cell line with and without HMGA2 overexpression. (B) Three-dimensional (3D) ex vivo spheroids (see Materials and Methods) were sectioned and examined in routine hematoxylin and eosin and immunostainsfor HMGA2 and Ki-67 (enlarged images to better view of Ki-67 positive cells). Dot plot showing the cell proliferation index (Ki-67 count) in nine spheroids of myometrial cell lines with and without HMGA2 overexpression. *P<.05; ***P<.001. (C) Examples of the dissected xenografts of myometrial cells with and without HMGA2 overexpression from NOD scid gamma (NSG) mice and the volume of MMhmga2 (n = 14) and MMvector (n = 13) xenografts at time of collection. (D, E) Ki-67 index and number of vessels detected by mouse CD31 in xenografts of MMhmga2 and MMvector. *P<.05; **P<.01. (F) Examples of xenograft sections examined by hematoxylin eosin and immunostains for HMGA2 expression, Ki-67 (cell proliferation marker), CD31 (highlighted vessels) in MMhmga2, and MMvector are illustrated.
