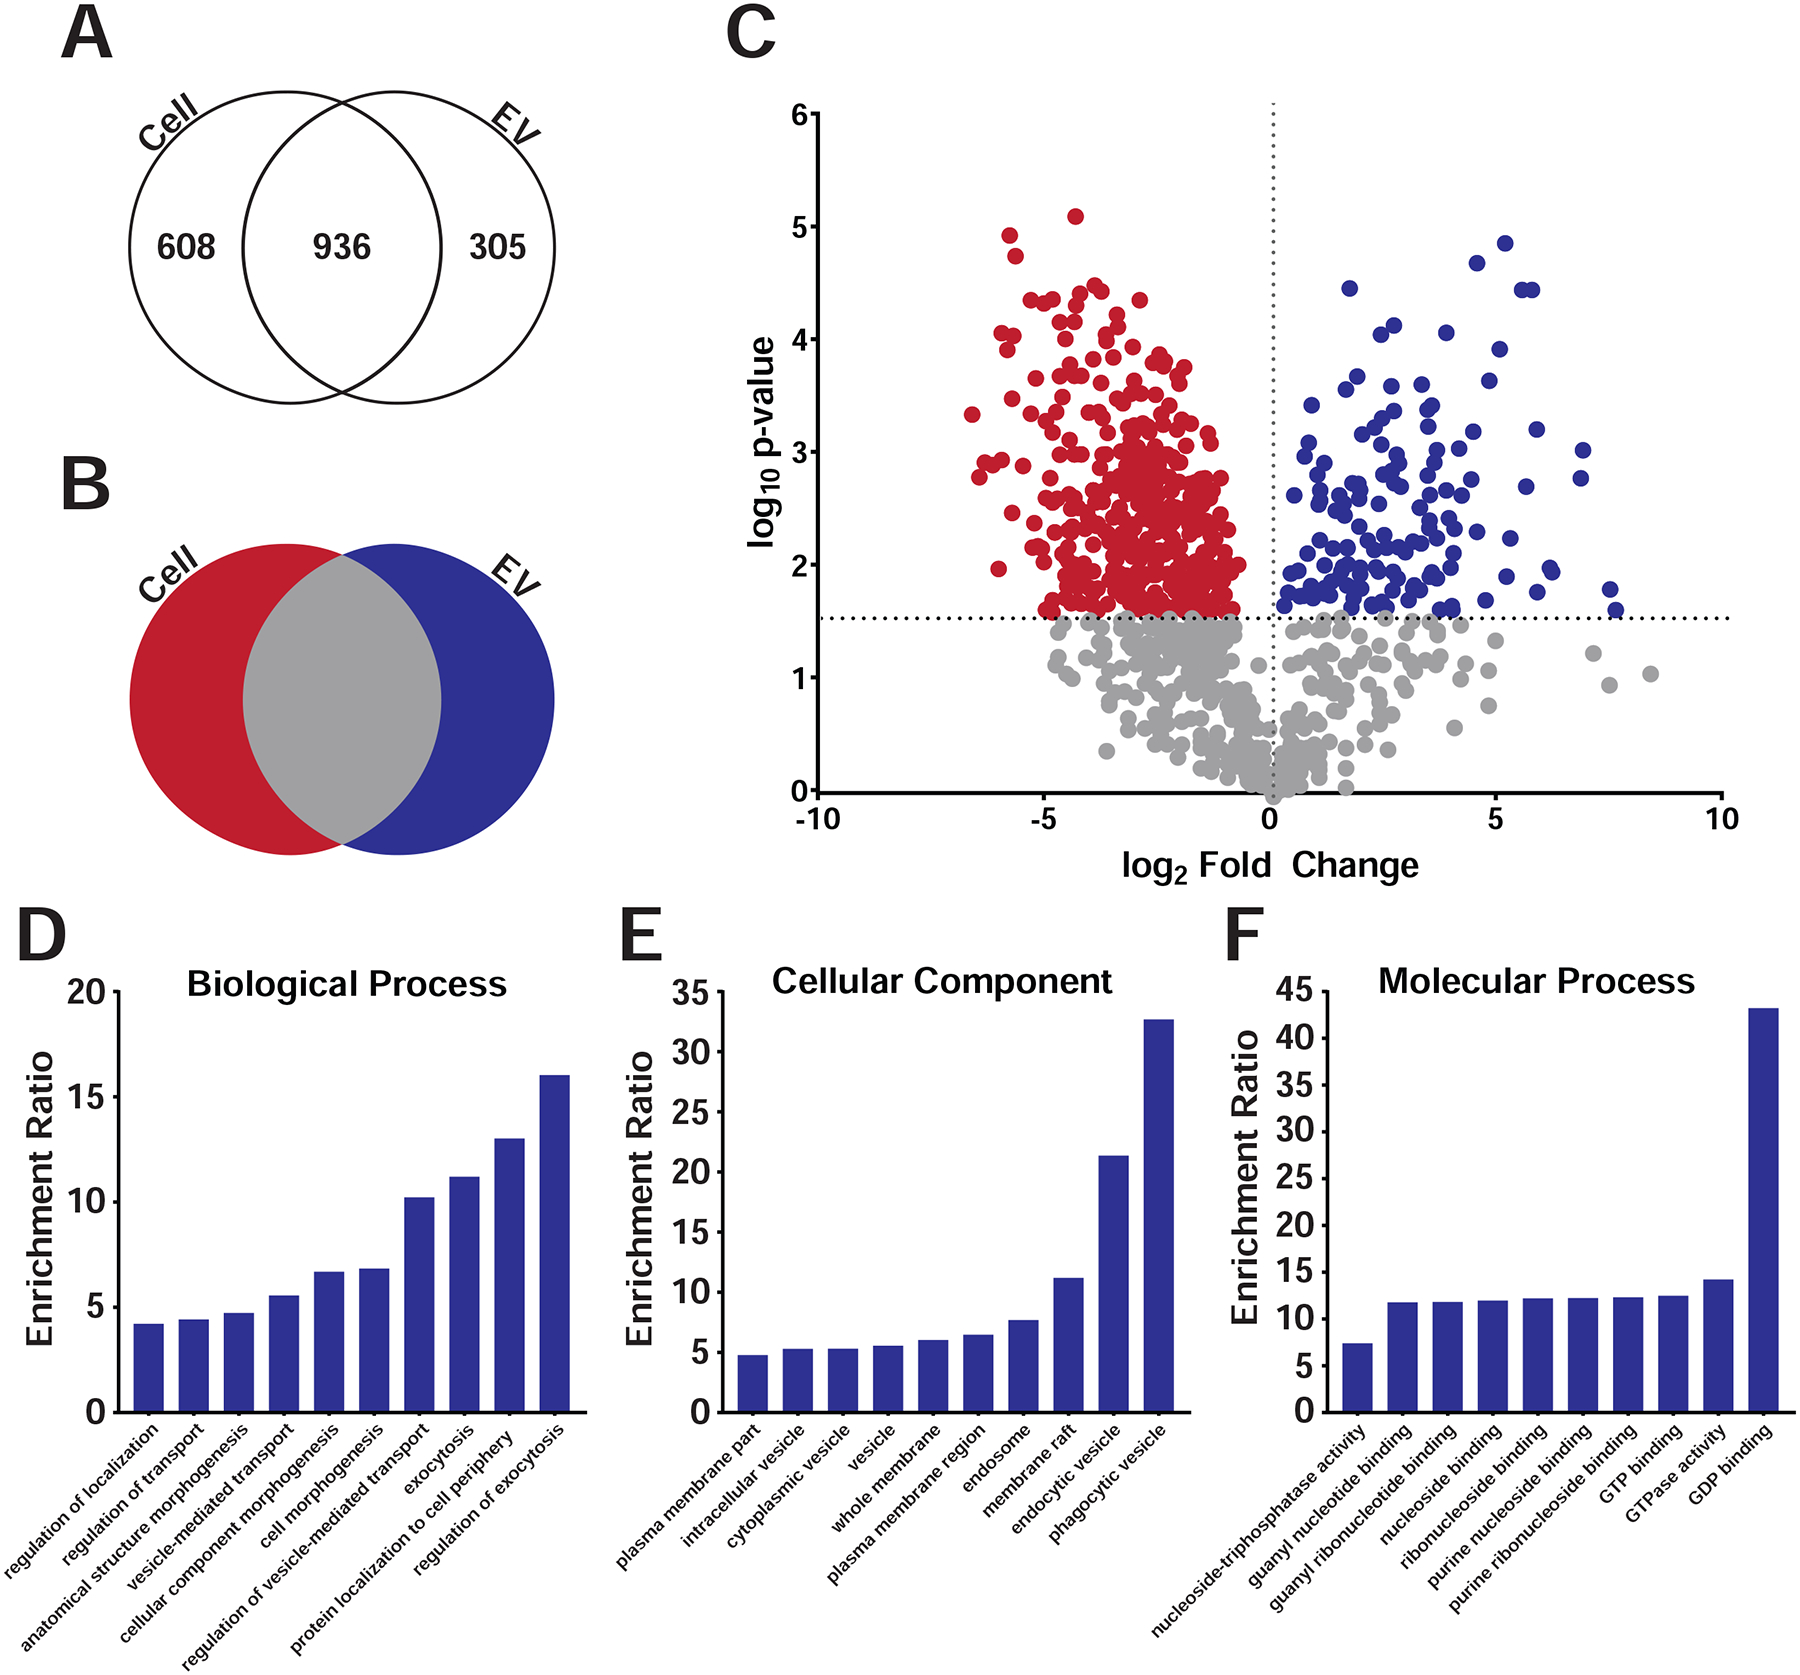
Fig 4. Proteomics analysis for C6 cells and EVs.

A) Gradient purified sEVs from C6 fractions were subjected to mass spectroscopy and protein levels compared between sEVs and parent C6 cellular levels. Venn diagram showing total detectable spectral counts found in cells, EVs, or both. B) Venn diagram showing enrichment of proteins in cells, EVs or both after excluding proteins with little to no detectable cellular levels. C) Volcano plot of proteomic analysis plotting p-value versus the fold change between cells (red) and EVs (blue) after excluding proteins with little to no detectable cellular levels. Red and blue dots indicate individual proteins enriched in either cells (red) or sEVs (blue) above a p-value threshold of p<0.02696 using the Benjamini-Hochberg test. D-F) Gene Ontology analyses of proteins in P2 sEVs showed enrichment in categories as shown.
