Figure 1:

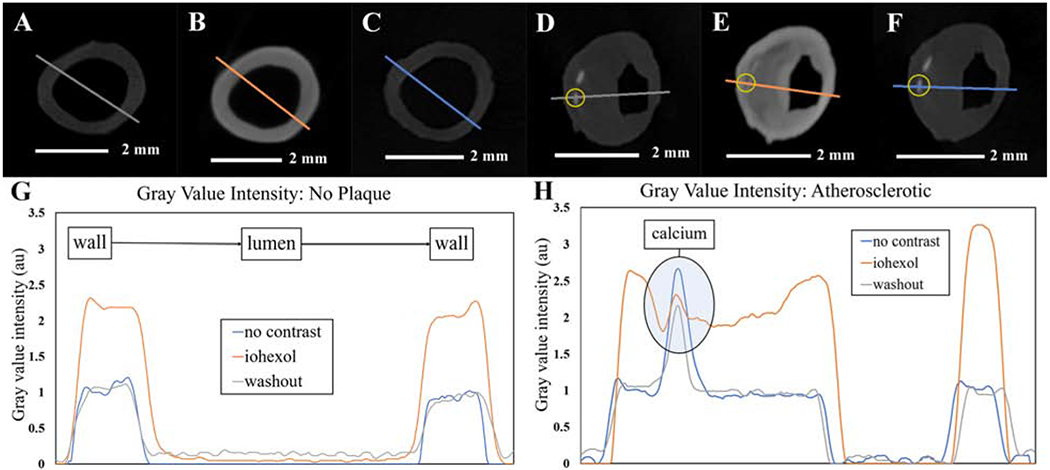
Gray value intensities in the absence and presence of iohexol.
(A, B, and C) Micro-CT sections of the same control (no plaque) sample, with no contrast (A) following iohexol staining (B) and after iohexol washout (C) with the colorized lines representing the line profile paths. (G) Plotted gray value intensities along the paths in A, B, and C. (D, E, and F) Same micro-CT section of the same atherosclerotic sample with no contrast (D), following iohexol staining (E), and after iohexol washout (F), with colorized lines representing the line profile paths and the yellow circles indicating the location of calcium phosphate deposition. (H) Plotted gray value intensities along the paths in D, E, and F with noted calcium spikes.
