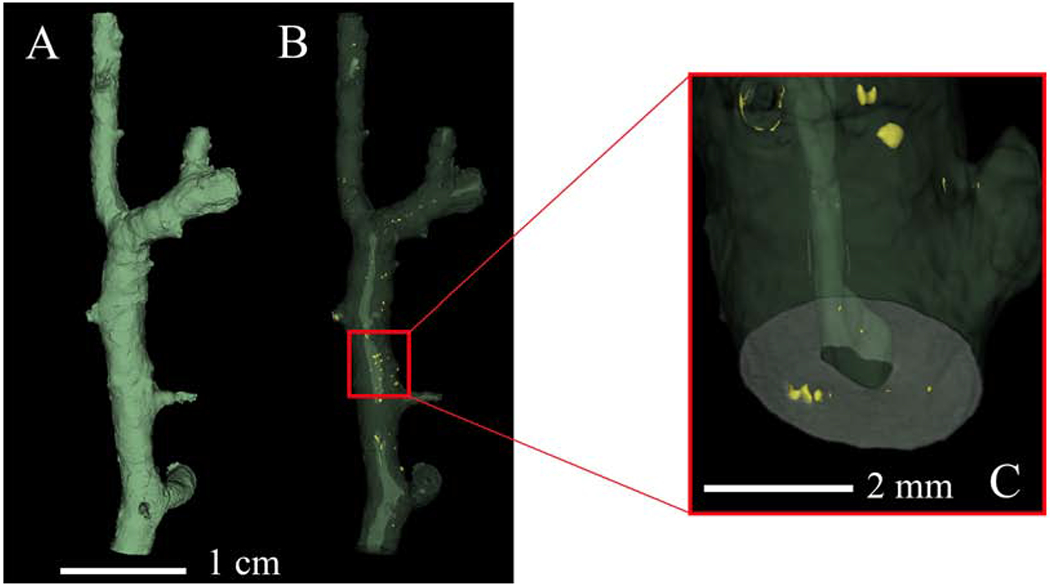
Figure 4:

3D visualization of calcium phosphate deposition. Calcium phosphate is segmented without the aid of a contrast agent.
(A) Full volumetric reconstruction of the micro-CT scanned sample. (B) Same volume represented in panel A but with phased out soft tissue (green) and with segmented calcium phosphate (yellow). (C) Magnification of a section in panel B illuminating calcium phosphate deposition (yellow) in the artery wall.
