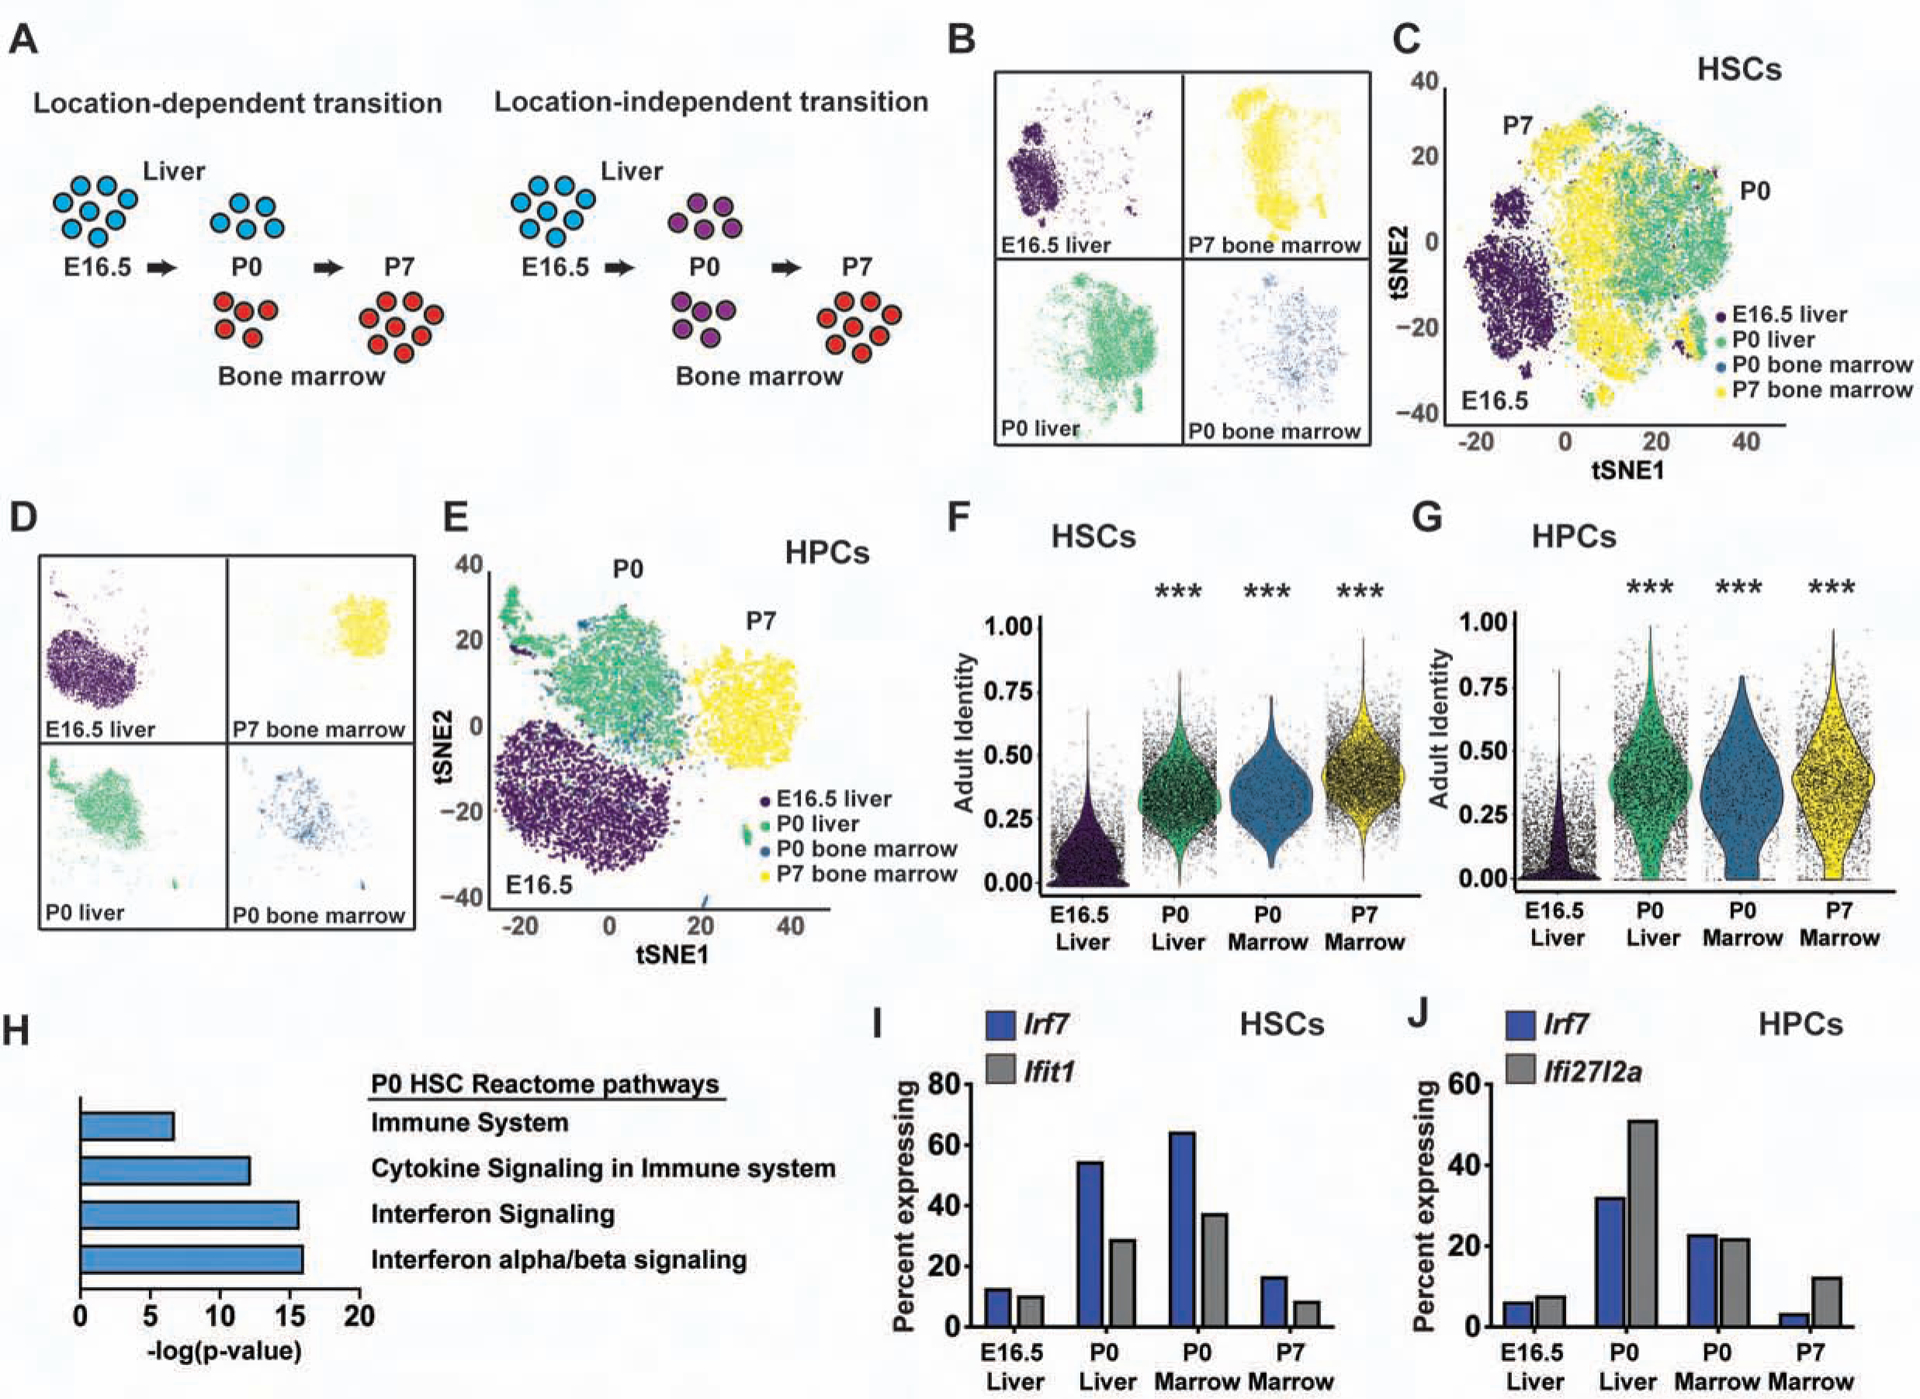
Figure 5. The transition from fetal to adult identity begins prior to birth and coincides with a transient pulse in type I IFN target gene expression.

(A) Overview of scRNA-seq profiles for location-dependent and location-independent transitions. (B-E) P0 liver and bone marrow HSCs (B, C) and HPCs (D, E) cluster together, and separate from both E16.5 and P7 HSCs/HPCs. (F, G) Adult identity scores for E16.5 liver, P0 liver, P0 bone marrow and P7 bone marrow HSCs and HPCs. ***p<0.0001 relative to E16.5; two-tailed Student’s t-test. (H) Reactome pathway analysis of genes expressed higher in P0 HSCs than E16.5 and P7 HSCs (FDR <0.001). (I, J) Percentages of HSCs and HPCs at each age with detectable Irf7, Ifit1 and Ifi27l2a expression. See also Figure S4, Tables S1 and S4.
