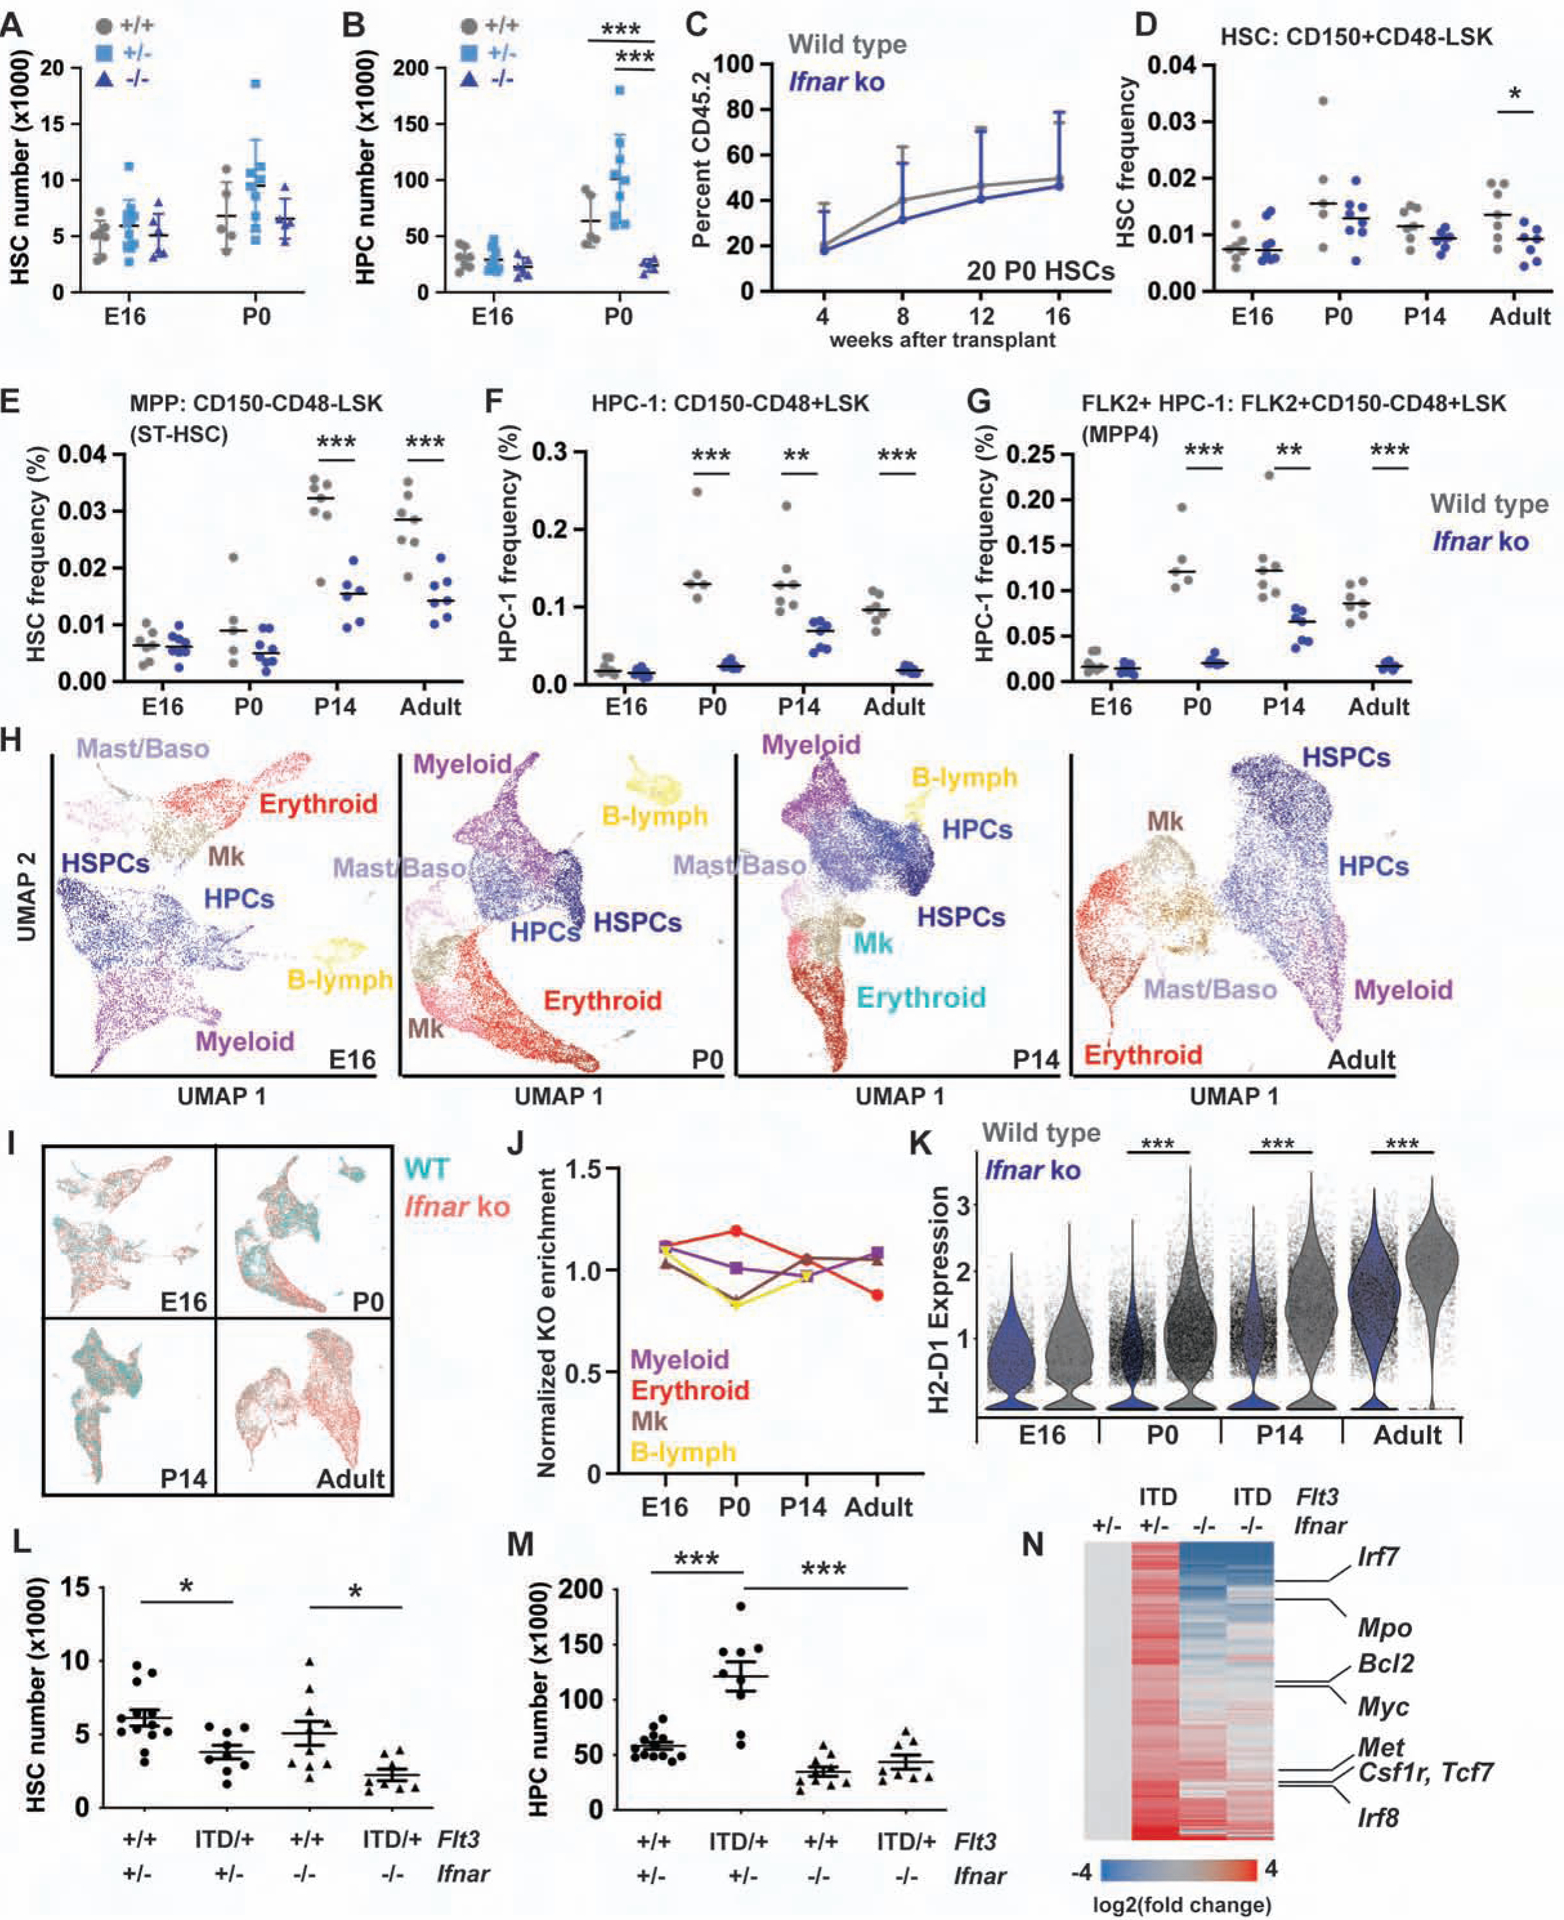
Figure 7. Ifnar deletion impairs perinatal HPC expansion and MHC-I expression, and it prevents FLT3ITD-driven HPC expansion.

(A, B) HSC and HPC numbers in E16 and P0, wild type, Ifnar+/− and Ifnar−/− livers. n=5–9. (C) Peripheral blood reconstitution from P0 wild type and Ifnar−/− HSCs. n=12–14. (D-G) HSC, MPP, HPC-1 and FLK2+HPC-1 frequencies in wild type and Ifnar−/− mice at E16, P0, P14 and 8-weeks old. n=5–8. (H) UMAP plots of Lineage−c-kit+ cells based on scRNA-seq transcriptomes at E16, P0, P14 and 8-weeks old. Clusters are color coded based on expression of known lineage markers (see Figure S7C for the adult example). (I) UMAP plots, as in H, with color coding to indicate wild type and Ifnar−/− cells. (J) Normalized frequencies of Ifnar−/− cells in each lineage biased population. (K) H2-D1 expression in wild type and Ifnar−/− Lineage−c-kit+ cells at indicated ages. (L, M) Hindlimb HSC/HPC-1 numbers in P14 Flt3 and Ifnar mutant mice. n=8–13. (N) Gene expression changes for Ifnar-dependent FLT3ITD targets. Genes involved in AML pathogenesis are indicated to the right. All error bars indicate standard deviations. *p<0.05, **p<0.01 and ***p<0.001; comparisons by one-way ANOVA (A, B) or a two-tailed Student’s t-test (D-G, K) with Holm-Sidak post-hoc testing. See also Figures S6 and S7, and Tables S1, S6 and S7.
