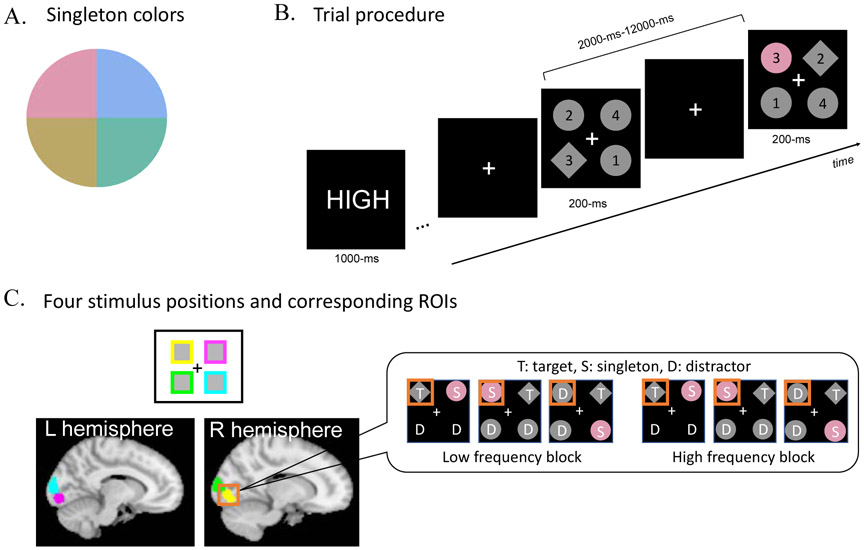
Figure 1.
Singleton colors, trial procedure, and ROIs. A. Singleton colors were chosen from CIELab color space (see text), B. At the beginning of each block, a cue indicated the upcoming block’s singleton frequency (HIGH or LOW) followed by a series of visual search trials on which participants were asked to find the predefined target (in this example, the diamond) and make a button press to indicate the number inside. C. Illustration of the four ROIs for each stimulus location (one in each visual quadrant) defined by the functional localizer and the Juelich probabilistic atlas for V1-V3. Display inset illustrates the six experimental conditions from which data were analyzed within a single ROI.

