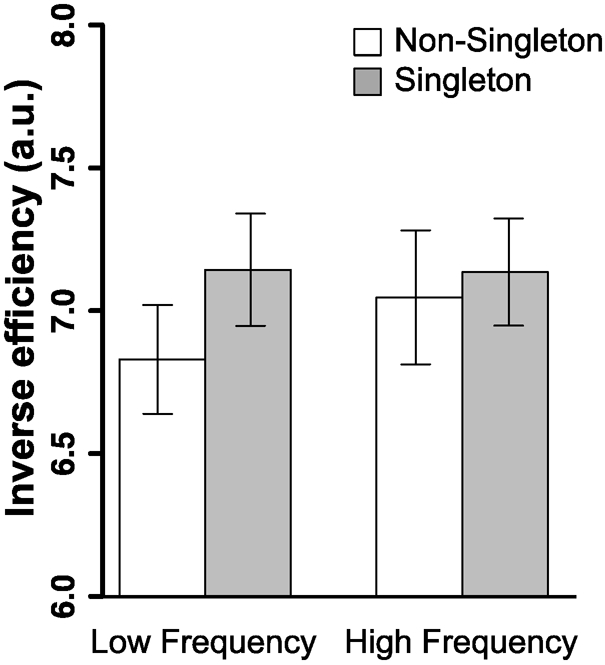
Figure 2.

Behavioral performance in the scanner. The inverse efficiency (IE) score was calculated as RT (ms) divided by percent accuracy (%); lower IE indicates better search performance. These results show that the interference by a singleton was reduced in the high frequency condition compared to that in the low frequency condition. All error bars shown here and in subsequent figures are ± 1 standard error of the mean.
