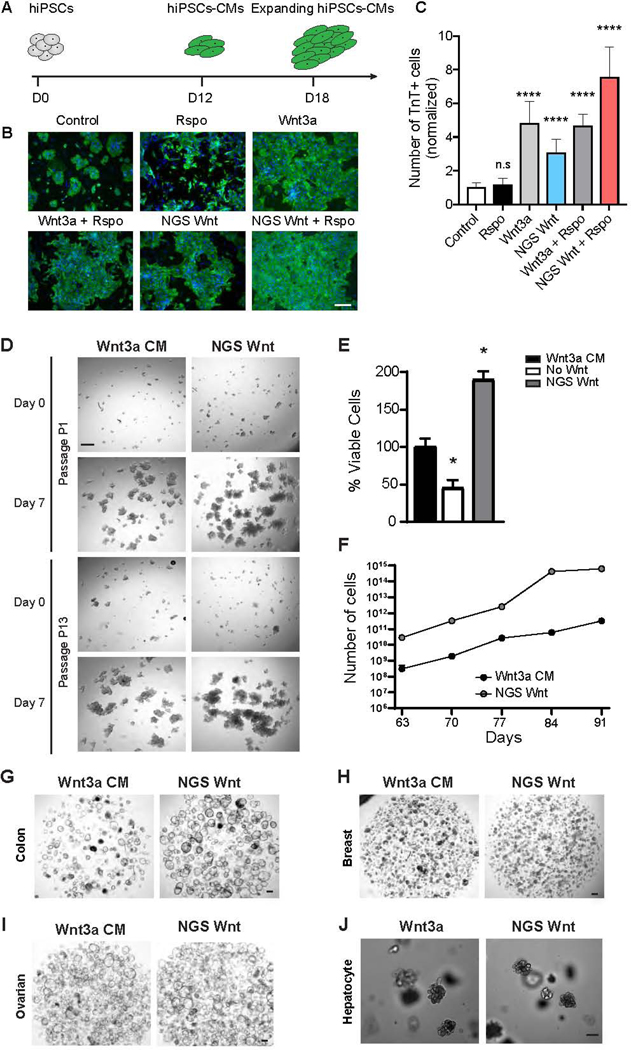
Figure 2. NGS Wnt promotes hiPSC-CM expansion and supports proliferation of multiple organoids.
(A) Experimental diagram of hiPSC-CM expansion. At day 12 (D12), hiPSC-derived CMs were treated with Wnt activators and expansion was monitored at day 18 (D18).
(B) Representative immunofluorescence images for cardiac troponin T (TnT) (green) and DAPI (blue) in hiPSC-CMs treated with indicated Wnt activators or control. Scale bar represents 100 μm.
(C) Quantification of the TnT positive cell number with the indicated Wnt activators orcontrol. **** indicates P<0.0001 by unpaired t-test. Data were from 3 independent experiments and 2 replicates. Results are expressed as mean and S.D..
(D) Representative brightfield images of human cystic fibrosis colon organoid cultures in either Wnt3a CM or NGS Wnt. N=5. Scale bar represents 100 μm.
(E) Quantification of viable cells (as percentage) of human cystic fibrosis colon organoids after first passage (7 days) cultured in Wnt3a CM, no Wnt source or NGS Wnt. * indicates P<0.05.
(F) Growth curves of human cystic fibrosis colon organoids were analyzed from passage P9 to P13. Cell number counts are expressed as mean and S.D. of three independent assays. * indicates P<0.05.
(G-J) Representative brightfield images of human colon, ovarian, breast and mouse hepatocyte organoids expanded with Wnt3a CM/Wnt3a or NGS Wnt at 0.5 nM. N=10 for colon and N=3 for other organoid types. Scale bar represents 100 μm.
See also Figures S3 and S4

