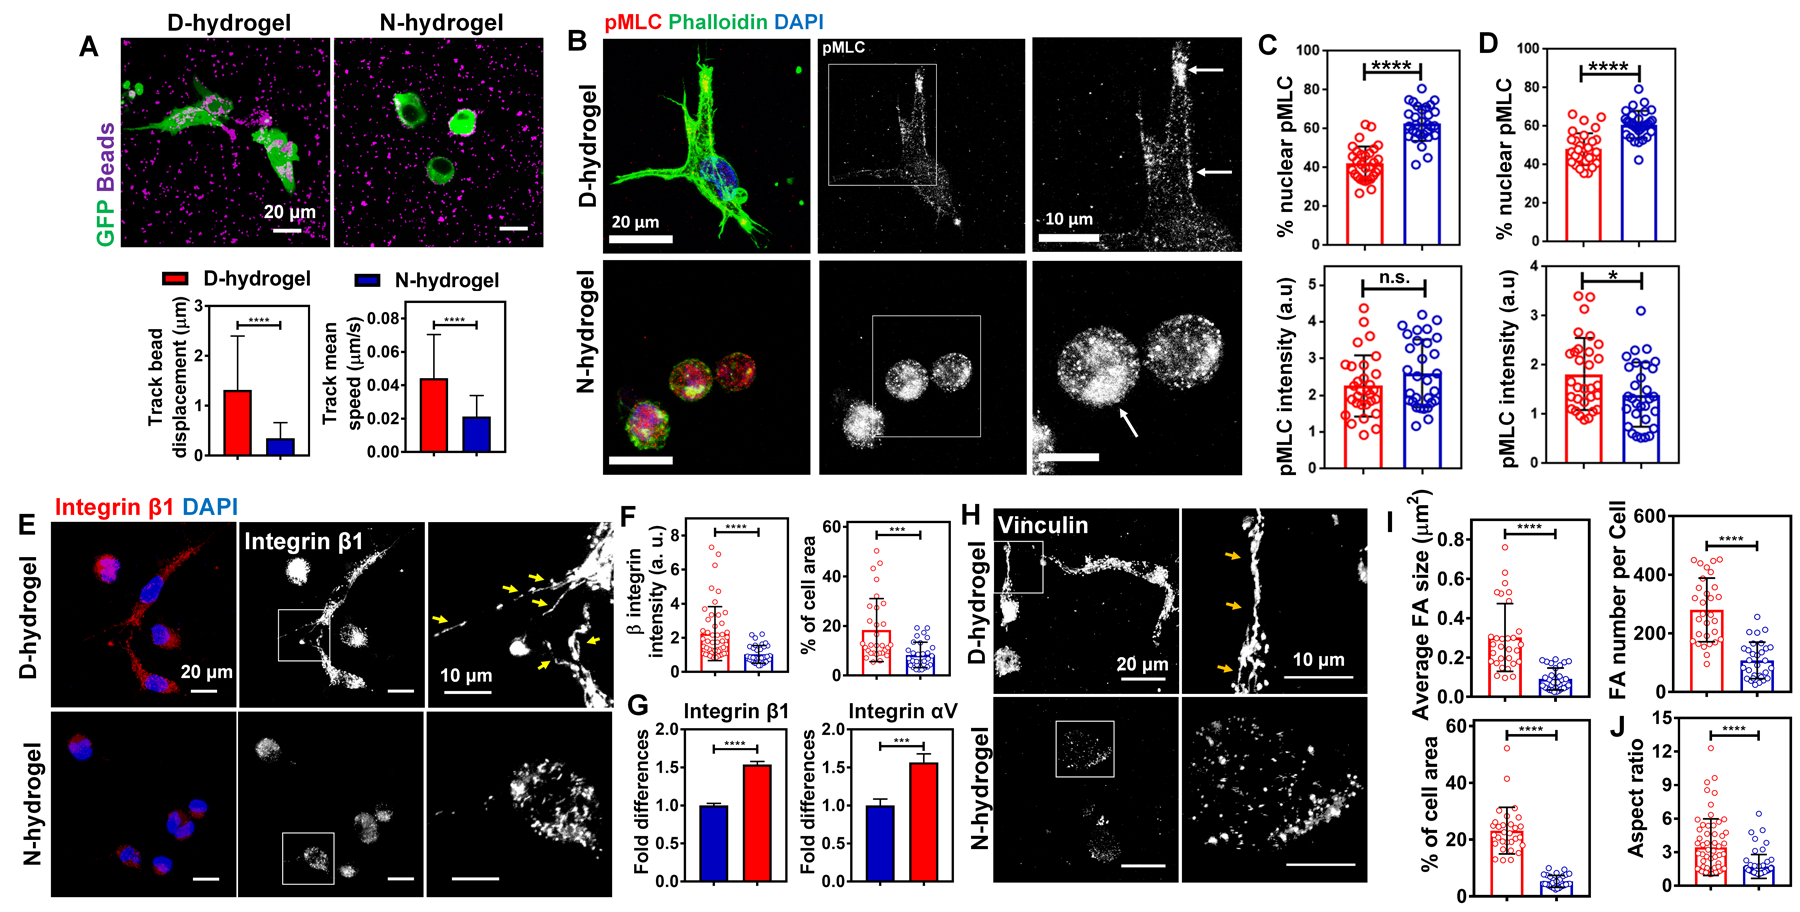
Fig. 3. Hydrogels with dynamic networks promote focal adhesion (FA) formation in encapsulated ECFCs.

See also Figure S4. (a) Representative IF images of ECFCs (in green) with fluorescent beads (in purple) in D-hydrogels and N-hydrogels, and quantification of displacement and speed of the beads over time lapse (n = 15 cells from biological triplicates). (D-hydrogels are in red and N-hydrogels are in blue). Scale bars are 20 µm (b) Maximum intensity projections of confocal images of cells 12h after embedding into N- and D-hydrogels show protrusion formation and localization of pMLC to actin in D-hydrogels. Cells embedded in N-hydrogels have round shape without any protrusions and pMLC localized to the nucleus (phalloidin in green, pMLC in red, DAPI in blue). Scale bars are 20 µm. (c) corresponding quantification (n=30 cells from biological triplicates) of normalized intensities (lower graph) and % nuclear protein to overall protein levels (upper graph). (d) Quantification of normalized intensities (lower graph) and % nuclear protein to overall protein levels (upper graph) of cells embedded into D- and N-hydrogels after 24 h in culture. (e) IF images of integrin β1 staining and (f) corresponding quantifications (n = 30 cells from biological triplicates) of the normalized intensities (left graph) and FA areas (calculated as a percentage of the total cell area; right graph) showing more FA in ECFCs encapsulated within D-hydrogels compared to N-hydrogels, after day 1 in culture. Scale bars are 20 µm and 10 µm for higher magnification of FA. (g) Real-time RT-PCR analysis show higher integrin β1 and integrin αV mRNA expression in ECFCs encapsulated in D-hydrogels compared with N-hydrogels after day 1 in culture. (h) IF images of GFP-ECFCs encapsulated in D-hydrogels and N-hydrogels stained for vinculin after day 1 in culture. Scale bar is 20 µm and 10 µm for higher magnification of FA. (i) Quantifications (n = 30 cells from biological triplicates) of FA size, number and areas using vinculin staining showing more FA in ECFCs encapsulated in D-hydrogels compared with N-hydrogels after day 1 in culture. (j) Quantifications (n = 60 cells from biological triplicates) of aspect ratio using F-actin staining, demonstrating ECFCs spreading to a higher degree when encapsulated in D-hydrogels compared with N-hydrogels after 1 day in culture. Significance levels were set at ***p ≤ 0.001 and ****p ≤ 0.0001.
