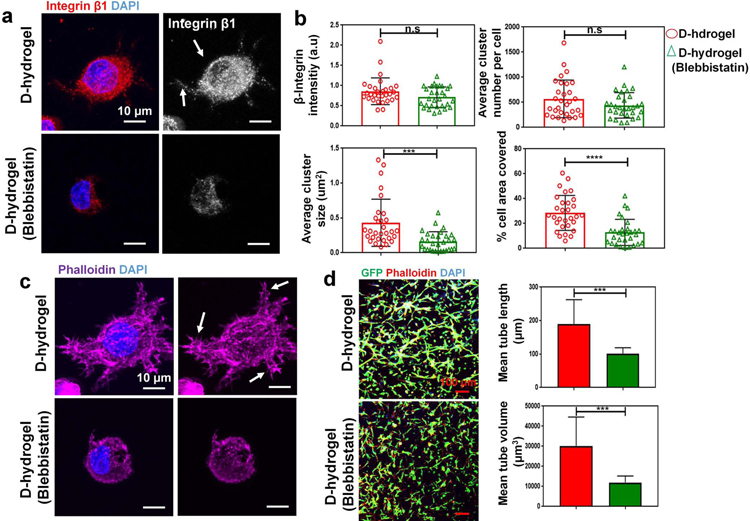
Fig. 4. Cell contraction mediates integrin clustering and subsequent vessel formation.
Inhibition of cell contractility with Blebbistatin leads to reduction in integrin cluster size. (a) Maximum intensity projections of confocal images show reduced integrin cluster size and area coverage in cells treated with 60 µm blebbistatin after 24 hrs in culture. (integrin β1 in red, nuclei in blue). Scale bars are 10 µm. (b) analysis of integrin cluster size, number per cell, are covered and relative intensity (n = 30 cells from biological triplicates) of the normalized intensities (top left graph) and integrin area (calculated as a percentage of the total cell area; bottom right graph) showing smaller integrin clusters in ECFCs encapsulated within D-hydrogels treated with blebbistatin for 24 hrs. (c) Maximum intensity projections of representative confocal image of reduced lamellipodial extension in ECFCs in D-hydrogels treated with blebbistatin for 24 hrs (nuclei blue, phalloidin magenta). Scale bare 10 µm. (d) Confocal projection images of day 3 (GFP-ECFC in green, nuclei in blue and phalloidin in red), showing inhibition of vasculature formation in blebbistatin treated cells compared to untreated controls. Scale bars are 100 µm. Quantitative analysis of vascular tube formation, in D-hydrogels and D-hydrogels treated with blebbistatin after 3 days showing a decrease in mean tube length, as well as mean and tube volume (analysis using Imaris Filament Tracer; N = 3 biological replicates with 4 images per replicate). Significance levels were set at ***p ≤ 0.001 and ****p ≤ 0.0001.

