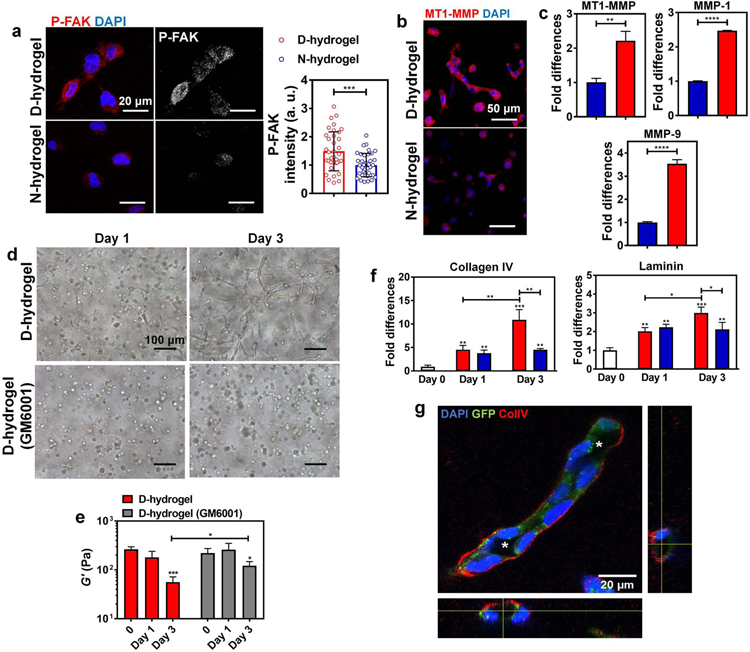
Fig. 5. Dynamic networks lead to the activation of FAK, matrix degradation via increased MMP expression and ECM deposition.
See also Figure S5. (a) Representative IF images and quantifications of the normalized intensities of P-FAK showing increased activation in ECFCs encapsulated in D-hydrogels compared to N-hydrogels (P-FAK in red, nuclei in blue) (n = 30 cells from biological triplicates). Scale bars are 20 µm. (b) Representative IF images of MT1-MMP stains showing higher expression of MT1-MMP in ECFCs encapsulated in D-hydrogels compared to N-hydrogels after 24 hrs in culture (MT1-MMP in red, nuclei in blue). Scale bars are 50 µm. (c) Real-time RT-PCR analysis show that ECFCs encapsulated in D-hydrogels highly express MT1-MMP, MMP-1 and MMP-9 mRNA compared to N-hydrogels. (D-hydrogels are in red and N-hydrogels are in blue) (d) Light micrographic images of ECFCs encapsulated in D-hydrogels treated with MMP inhibitor GM6001, at a concentration of 0.1 mM after days 1 and 3 of culture, showing inhibition of sprouting and vasculature formation compared to untreated controls. Scale bars are 100 µm (e) The G’ of ECFC-loaded D-hydrogel controls and D-hydrogels treated with GM6001 along with 3 days culture period. (f) Real-time RT-PCR analysis show that ECFCs encapsulated in D-hydrogels highly express Collagen IV and laminin on day 3 of culture compared to N-hydrogels. (g) Representative confocal maximum intensity projection with orthogonal views (on the bottom and right side of the image) of ColIV stains (in white/red; cells in green; nuclei in blue) after 3 days in D-hydrogels show strong localization of ColIV at the basement membrane of the lumenized vessels. Lumens are indicated with an asterisk. Scale bars are 20 µm. For graphs: D-hydrogels are in red, D-hydrogels treated with GM6001 or cells before encapsulation are in grey. Significance levels were set at *p ≤ 0.05, **p ≤ 0.01, ***p ≤ 0.001 and ****p ≤ 0.0001.

