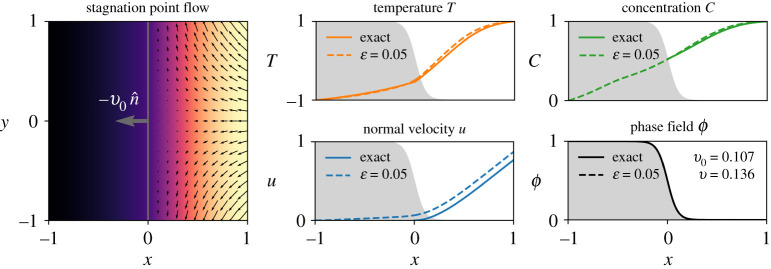
Figure 2.
On the left, we illustrate stagnation point flow towards a melting interface. The fluid velocity decreases to zero at the interface (black arrows x > 0), and the vertical velocity is proportional to y. The interface velocity (grey arrow at x = 0) uniformly recedes to the left. The temperature (in colour) decreases towards the left, and is invariant in y (as are all quantities excepting the vertical fluid velocity). The concentration (not shown) decreases similarly. We also plot reference and phase-field solutions for temperature T, solute concentration C, normal velocity u and phase field ϕ as a function of x in the second and third columns. Only the temperature exists inside the solid in the reference solution. We negate the normal fluid velocity u for clarity. (Online version in colour.)

