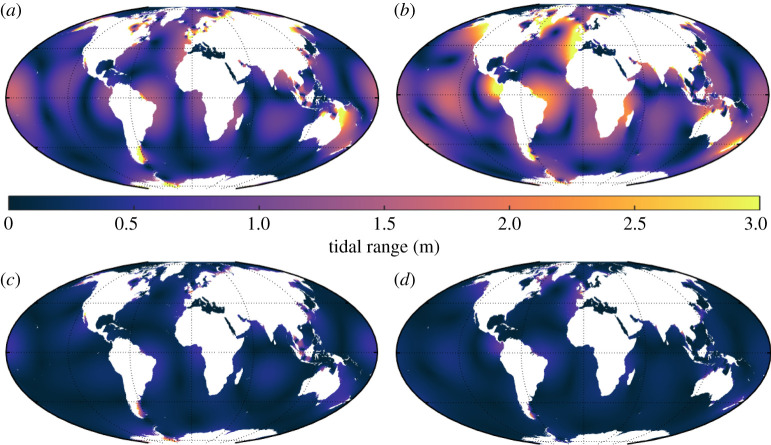
Figure 2.
(a,b) show the modelled M2 tidal ranges (in metres) for the PD control (a) and PD reconstructed simulations (b). The RMS error values between the modelled and the TPXO M2 amplitudes are approximately 12 cm for PD and approximately 20 cm for PD reconstructed. (c,d) as in (a) and (b) but for the S2 constituent. (Online version in colour.)

