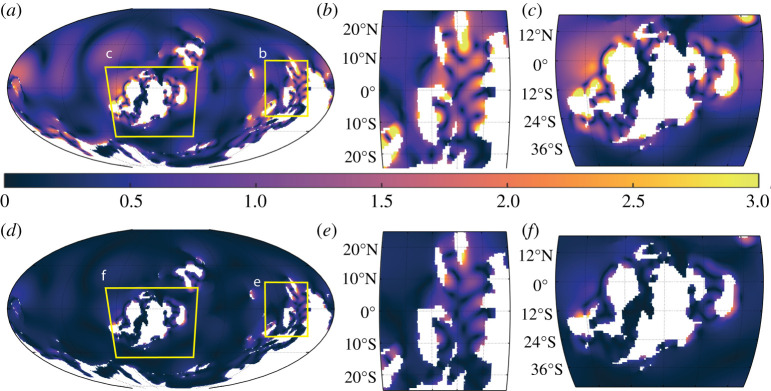
Figure 3.
The 420 Ma simulation with tidal range (colour, range in metres) for M2 (a–c) and S2 (d–f). Enlarged areas of evolutionary interest are shown in (b) and (e) for the South China region and (c) and (f) for Laurussia. Note that the S2 range is equal to the spring–neap range difference, so panels (d–f) show the spring–neap range difference as well. (Online version in colour.)

