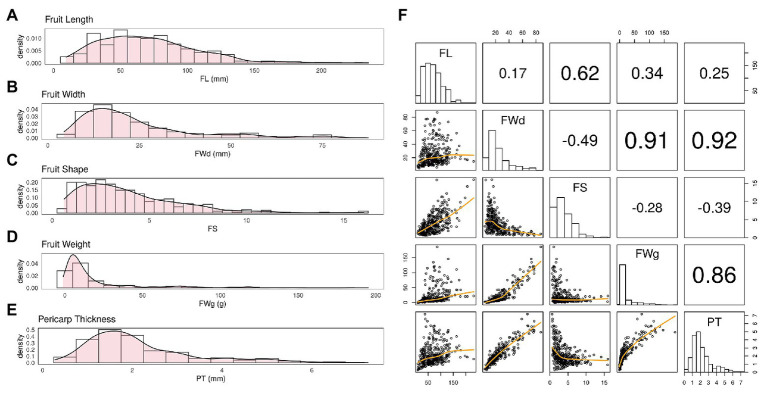
Figure 2.
Distribution of BLUP values varies by trait. (A) Fruit length (FL) showed a fairly normal distribution with slight skewness. (B,C) Fruit width (FWd) and fruit shape (FS) showed a similar distribution to FL. (D) Fruit weight (FWg) showed the most skewed distribution among the four traits. (E) Pericarp thickness (PT) also showed a fairly normal distribution. (F) The correlation was 0.92 for FWd and PT, 0.91 for FWd and FWg, and 0.86 for FWg and PT. These Pearson correlation among traits showed highly correlation among FWd, FWg, and PT.

