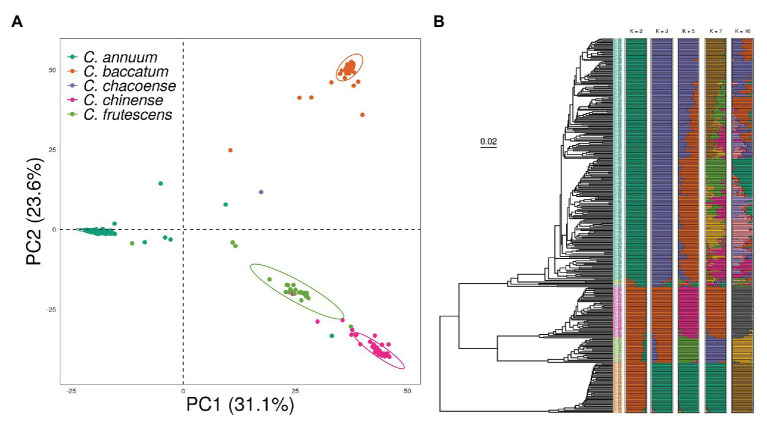
Figure 3.
Population structure of the pepper core collection showing a distinct population structure based on species. (A) Principal component analysis (PCA) indicates strong separation of each cluster. (B) Phylogenetic tree made by using unweighted pair group method with arithmetic mean (UPGMA) showing a similar clustering pattern to PCA. In the ADMIXTURE Q plots, accessions cluster as C. annuum or other species when K = 2. When K = 5, almost all samples cluster into four species, with additional clustering within C. annuum.

