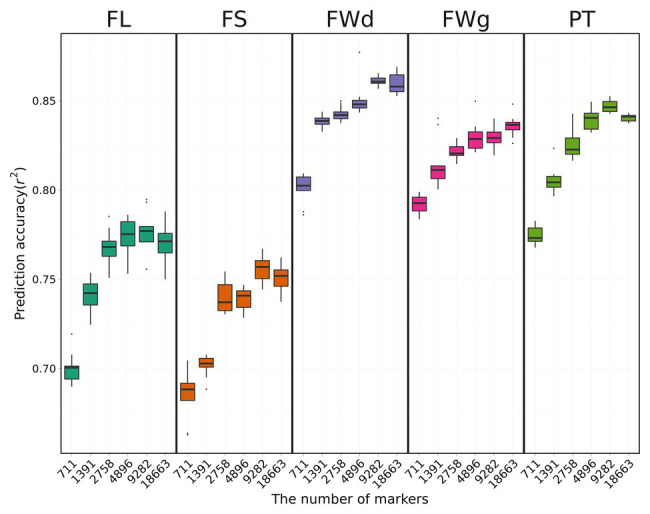
Figure 5.

Cross-validation results using the RKHS method with various marker sets. Boxes indicate the range of upper quartile and lower quartile, and the bar in the box is the median. Whiskers from upper quartile to maximum and lower quartile to minimum are vertical lines. Black spots are outliers. Prediction accuracy tends to decrease with fewer markers.
