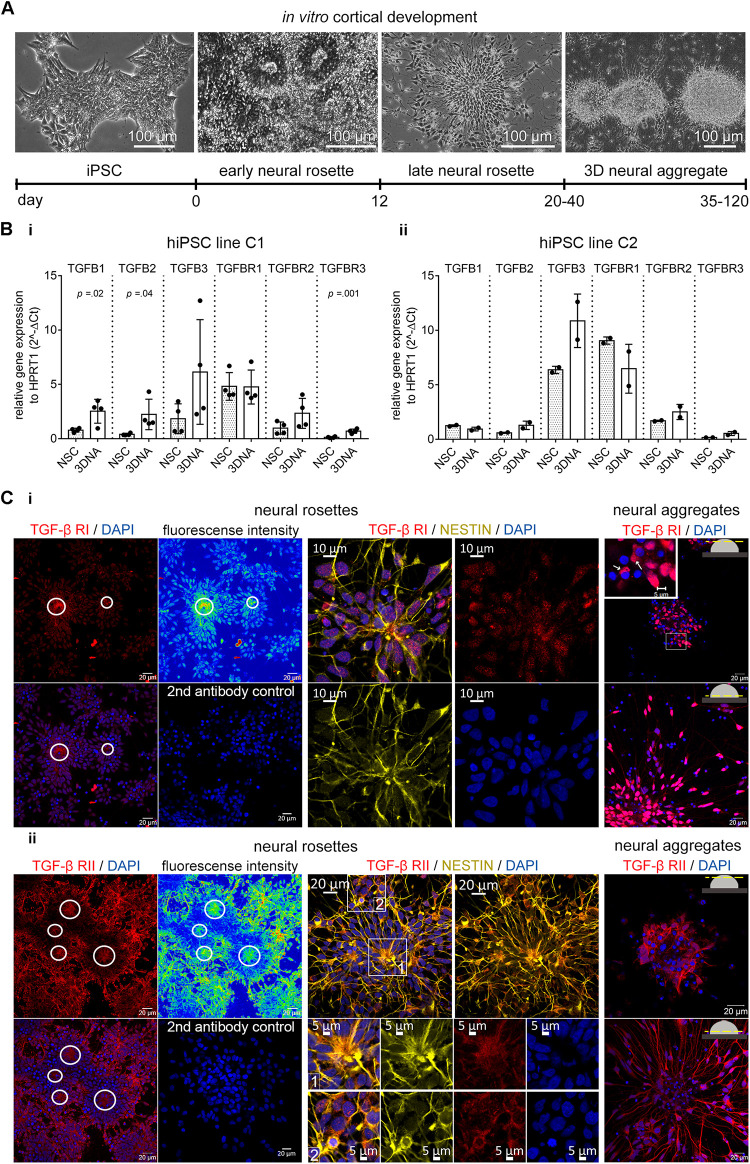
FIGURE 2.
TGF-β receptors and ligands in human iPSC-derived neural in vitro model. (A) Phase contrast images and related timeline show the in vitro cortical development from hiPSCs toward 3D neural aggregates. (B) Gene expression of TGFB ligands and receptors in human iPSC-derived neural rosette (NSC) and neural aggregate (3DNA) cultures in (i) hiPSC line C1 and (ii) hiPSC line C2. The data is presented as mean ± standard deviation, unpaired t-test was used to calculate the indicated p-values. N = 1–2/cell line, each dot represents the value from one technical replicate. (C) Confocal images of (i) TGF-β1 RI and (ii) RII in the NESTIN+ cells in neural rosettes (left) and in the neural aggregates (right). Color coded fluorescent density images and circles highlight the accumulation of TGF-β receptors at the luminal side of neural rosettes. The secondary antibody control images are also shown (2nd antibody control). Insets highlight the cytoplasmic localization of TGF-β RI and II.

