FIGURE 3.
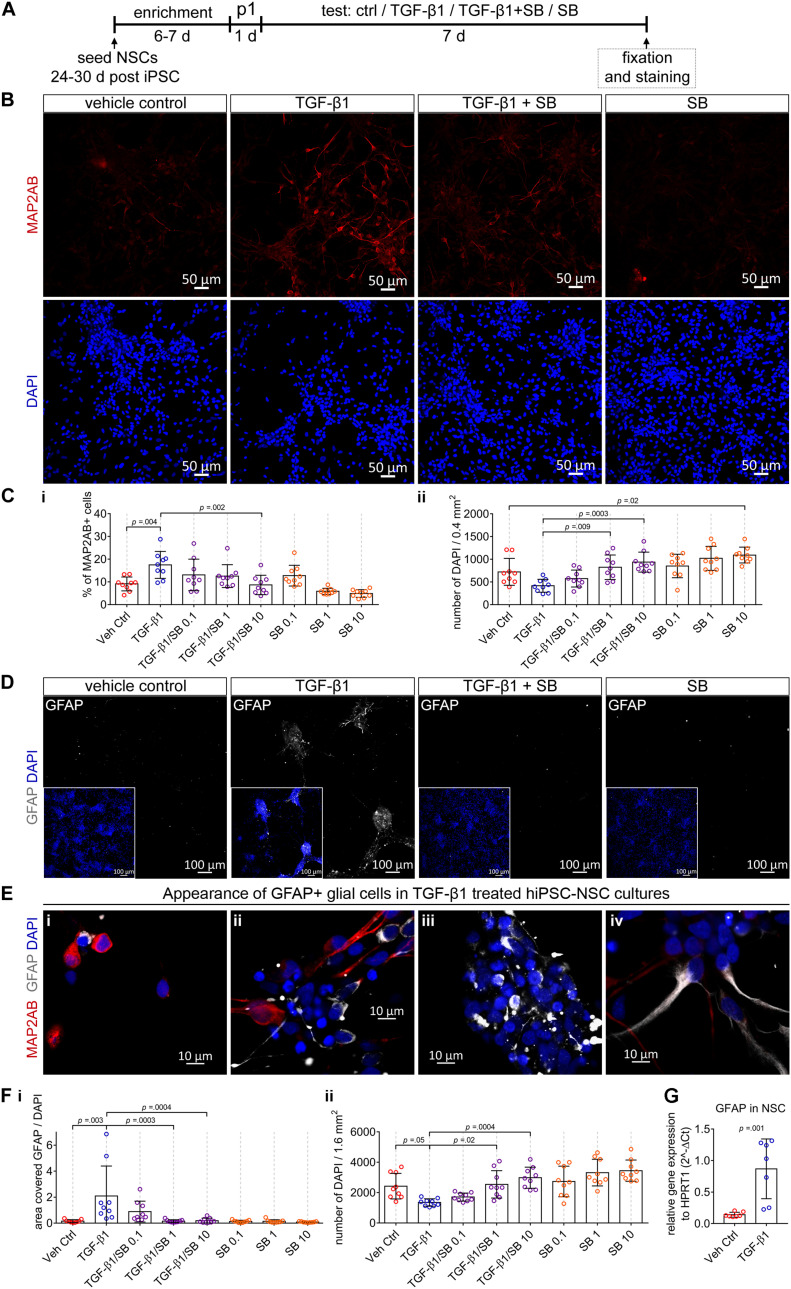
The impact of TGF-β1 in human iPSC-derived neural stem cell cultures. (A) Schematic representation of the experimental design. (B) Confocal images visualize MAP2AB+ neurons in vehicle control, TGF-β1, TGF-β1 + SB, and SB treated hiPSC-NSC cultures. (C) Diagrams show the percentage of MAP2AB+ neurons (i) and the number of DAPI cells (ii) quantified in the cultures in the indicated conditions (hiPSC line C1, N = 3, n = 2–3). (D) Example overview images (10x) visualizing GFAP+ glial cells in vehicle control, TGF-β1, TGF-β1 + SB, and SB treated hiPSC-NSC cultures. (E) Example confocal images (40x) visualize the appearance of GFAP+ glial cells among MAP2AB+ neurons, in TGF-β1 treated hiPSC-NSC cultures. (F) Diagrams show (i) the area covered by GFAP+ glial cells and (ii) the number of DAPI cells quantified in the cultures under the indicated conditions (hiPSC line C1, N = 3, n = 3). (G) Gene expression of GFAP in vehicle control and TGF-β1 treated cultures (hiPSC line C1 and C2, N = 2, n = 1–2). The data is presented as mean ± standard deviation. Either one-way ANOVA with Tukey’s correction (multiple comparisons) or unpaired t-test was used to calculate the indicated p-values.

