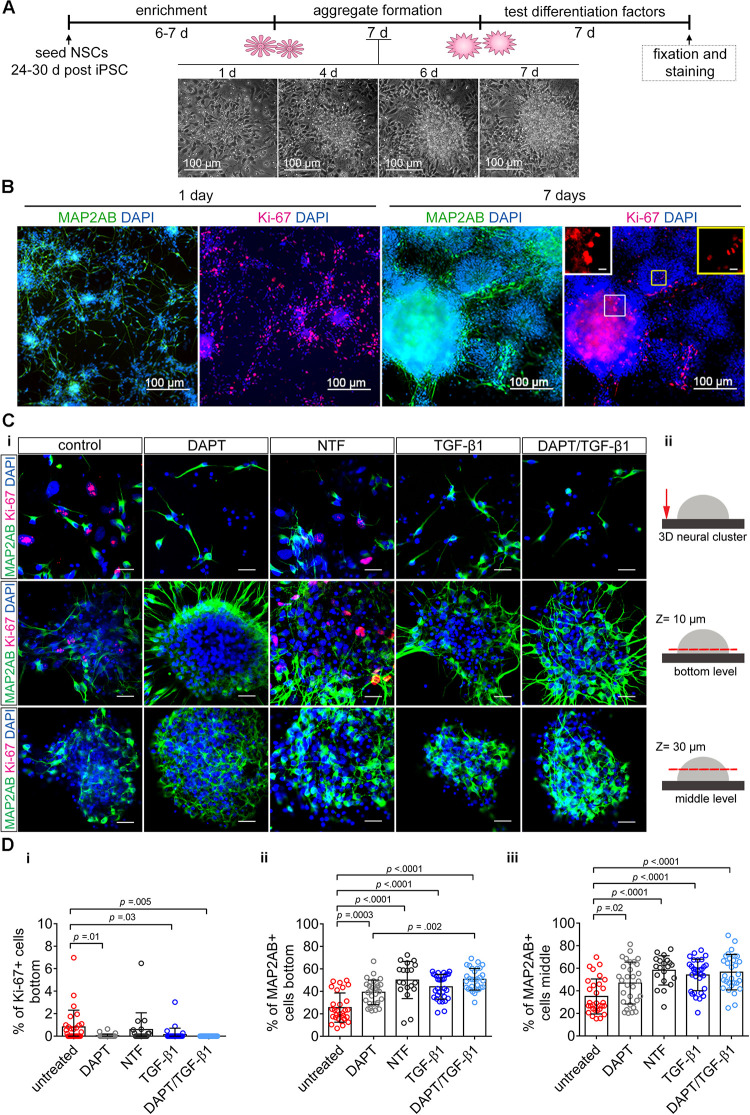
FIGURE 4.
The impact of TGF-β1 on human iPSC-derived 3D neural aggregates. (A) Schematic representation of the experimental design. Time-lapse imaging shows the transition of neural rosette toward 3D-neural aggregate within 7 days. (B) Confocal images visualize MAP2-AB+-neurons and Ki-67+-cells in neural rosettes and 3D-neural aggregates (day 30 post iPSC stage). Insets show Ki-67+-cells at higher magnification. (Ci) Detailed confocal images visualize MAP2AB+-neurons and Ki-67+-proliferating cells in untreated, DAPT, neurotrophic factor mix (see main text), and TGF-β1 and DAPT/TGF-β1 treated hiPSC-NSC cultures. Scale bar: 20 μm. (Cii) Schematic drawings illustrate the regions and z-levels of image acquisition. (D) Diagrams show the percentage of (i) Ki-67+-cells and (ii,iii) MAP2AB+-neurons under the indicated culture conditions. Data are shown as mean ± standard deviation, one-way ANOVA with Tukey’s correction (multiple comparisons) was used to calculate the indicated p-values (line ChiPS4, N = 3, each dot represents one aggregate, taken from 2 to 3 technical replicates).

