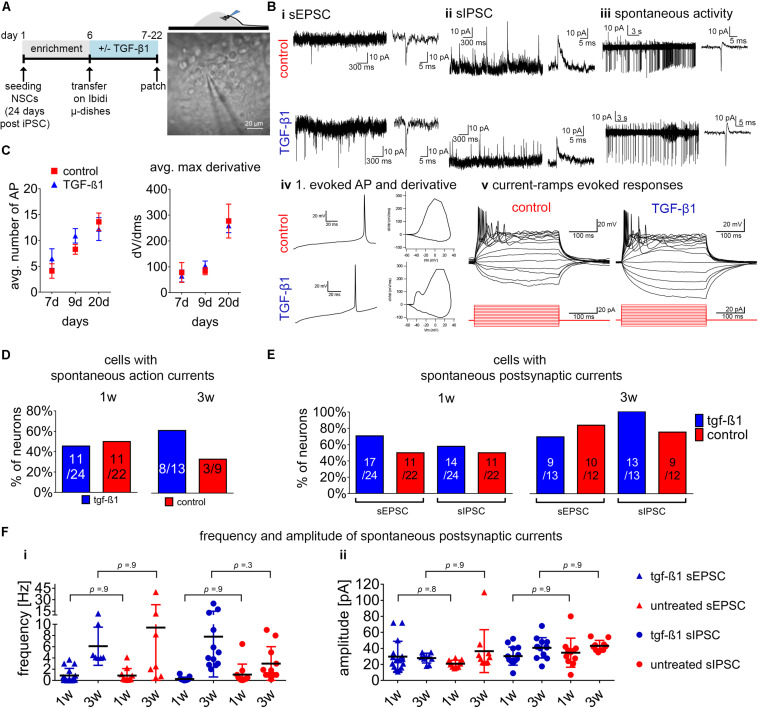
FIGURE 5.
Assessment of TGF-β1 in functional neuronal maturation. (A) Schematic representation of the experimental design on the left and phase-contrast image on the right illustrating the position of the patch-clamp electrode at 3D-neural aggregates to assesses the electrophysiological functionality in untreated and TGF-β1 treated hiPSC-NSC cultures. (B) Examples of recorded spontaneous synaptic (i) excitatory post-synaptic currents (EPSC), (ii) inhibitory post-synaptic currents (IPSCs), (iii) spontaneous action currents and (iv) first evoked action potential and phase-plan plots, and (v) example sweeps showing evoked action potentials in response to depolarizing current pulses in cells. Visualized injected current pulses (300 ms) starting from –20 toward 50 pA (15 pulses with steps of 5 pA, from hyperpolarizing to depolarizing) from the holding current. (C) Diagrams show the average number of action potentials and average max derivatives recorded at 1 and 3 weeks of cultivation. (D) Diagram presents the percentage of neurons showing spontaneous action currents after 1 and 3 weeks in culture. (E) Diagrams show the percentage of neurons showing spontaneous postsynaptic currents, and (F) frequency and amplitude of spontaneous postsynaptic currents recorded after 1 and 3 weeks in culture. Data are shown as mean ± standard deviation, one-way ANOVA with Tukey’s correction (multiple comparisons) was used to calculate the indicated p-values (line ChiPS4, N = 2, n = 2–3).

