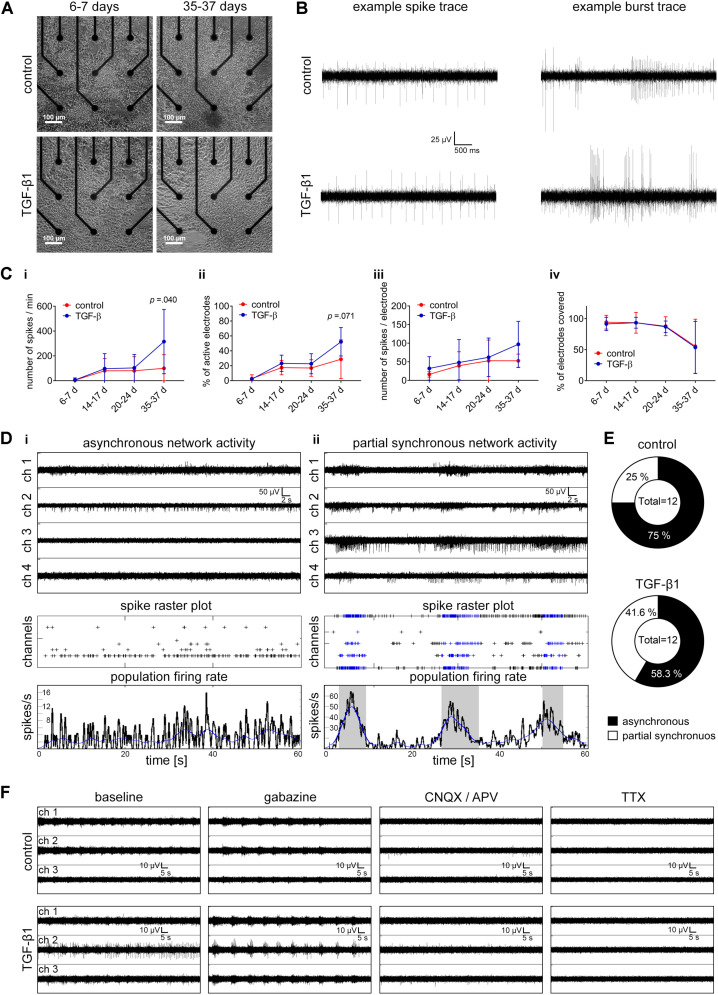
FIGURE 6.
Assessment of TGF-β1 in functional neuronal circuit formation. (A) Phase-contrast images show the morphology of TGF-β1 treated and untreated hiPSC-neural cells cultured on a nine-electrode array of a six-well MEA for 1 week and 5 weeks. (B) Example traces of spiking and bursting activity recorded in TGF-β1 treated and untreated hiPSC-neural cultures. (C) Diagrams illustrate neuronal population activity parameters in TGF-β1-treated and untreated hiPSC-neural cultures. Data are presented as mean ± SD. Unpaired t-test between the groups was applied to calculate the indicated p-values (hiPSC line C2 and ChiPS4, N = 2–3, n = 6 per condition per line). (D) Representative examples of MEA recordings, spike raster plots (SRP) and population-firing rates illustrate the activity of asynchronously active (i), and partially synchronously active (ii) neuronal populations. (E) Pie charts illustrate the percentage of hiPSC-neural cultures showing asynchronous or partially synchronous neuronal activity in TGF-β1 treated and untreated groups. (F) Representative examples of MEA recordings showing neuronal activity of TGF-β1 treated and untreated hiPSC-neural cultures before and after Gabazine, CNQX, AP-5, and TTX-treatment, respectively.

