Figure 4.
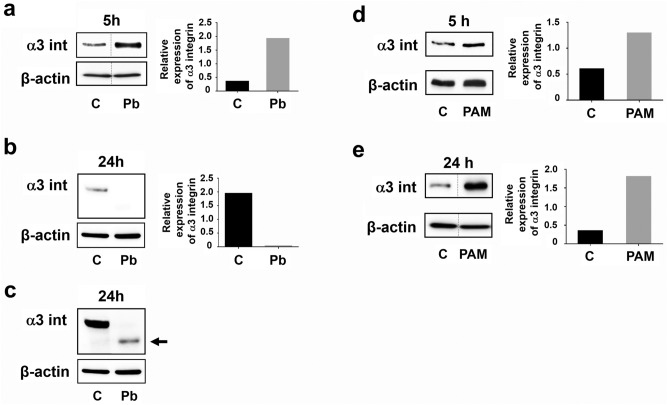
α3 integrin levels in A549 cells after incubation with P. brasiliensis yeasts or PAM3CSK4. A549 cells were incubated or not (C) with P. brasiliensis yeasts (Pb) (MOI = 2.5) (a–c) or with 5 μg/mL of the TLR2-specific ligand PAM3CSK4 (PAM) (d,e). After 5 h or 24 h, epithelial cells were lysed and aliquots were submitted to SDS–PAGE. α3 integrin levels (α3 int) were analysed by Western blot. (c) α3 integrin levels from (b) in a higher exposure time in the UVITEC imaging system. Arrow corresponds to a band with lower molecular weight than α3 integrin (150 kDa). β-actin was used as loading protein control. Relative α3 integrin levels were determined by densitometric analysis. Values represent the ratio of the intensity of α3 integrin band divided by the corresponding intensity of β-actin band. Similar results were obtained from three independent experiments. Dashed lines in (a,e) represent cropped images. Uncropped images are presented in Supplementary Fig. S4.

