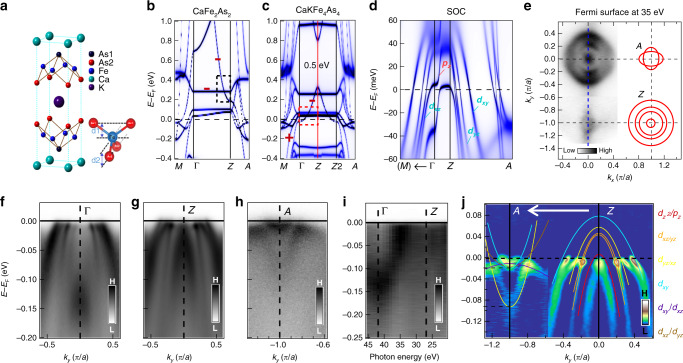
Fig. 1. Topological band inversion induced by bilayer structure in CaKFe4As4.
a The crystal structure of CaKFe4As4 with the inset of the As-Fe-As tetrahedron. The bond lengths (d1, d2) and angles are different between Fe-As1 and Fe-As215. b–d DFT+DMFT calculation results for the band structures of b CaFe2As2, c CaKFe4As4, and d CaKFe4As4 with SOC, respectively. In the b, c, the red symbols of “+” and “−” represent the band parity, and the red (black) dashed line box marks the position of the topological nontrivial (trivial) band inversion. The glide-mirror symmetry breaking effect in 1144 system is visible by comparing the band structures of CaFe2As2 with CaKFe4As4. In CaKFe4As4, a large hybridization gap (~0.5 eV) is formed between the folded pz bands, and a band inversion with a SOC gap of 20 to 30 meV is found near EF at d. e Fermi surfaces measured by ARPES at a photon energy of 35 eV, which is around the middle point of Γ–Z, note that the ‘a’ in scale is 2.73 Å referring to the Fe–Fe distance of CaKFe4As4 in the real space; the red contours on the right are extracted from DFT+DMFT calculation at Z and A, which shows good consistence with experimental Fermi surface. f–h ARPES spectral intensity plots along the blue dashed line in e with p-polarized photons at energies of 42 eV (Γ) and 27 eV (Z and A). i ARPES spectral intensity plot along the Γ–Z direction measured under photon energies from 21 to 45 eV. j The momentum distribution curve (MDC) second derivative of the ARPES intensity plot along the A–Z direction obtained from g, h, which enhances the vertical part of the band but suppresses the horizontal part of the band32, with comparison to the calculated results from d (plotted as colored lines).

