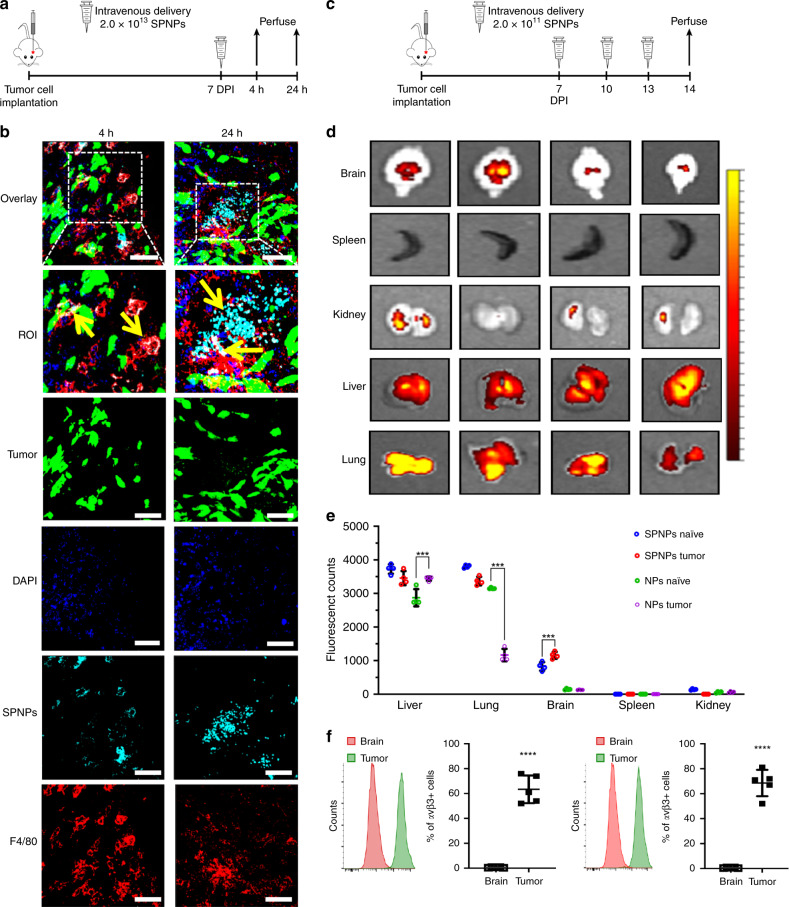
Fig. 2. in vivo brain targeting and biodistribution of SPNPs.
a Timeline for the tumor-targeting study. Mice were IV administrated a single dose of 2.0 × 10¹³ SPNPs or empty NPs (no iRGD) via the tail vein seven days post GL26 tumor cells implantation. Confocal imaging of sectioned brains was performed 4 and 24 h post particle administration. b Alexa Fluor 647 labeled SPNPs (cyan) colocalize (indicated with yellow arrows) with macrophages (red) and tumor cells (green, mCitrine). Notably less NPs are observed in the tumor microenvironment 4 h post systemic delivery compared to 24 h. Representative images from a single experiment consisting of three biological replicates per group are displayed. Scale bars = 50 µm. c Timeline representation of the biodistribution study. Mice were IV administered 2.0 × 10¹¹ SPNPs or empty NPs 7, 10, and 13 days post tumor cell implantation or saline injection. d Fluorescence imaging of tumor-naive and tumor-bearing mice organs sacrificed at 24 h post final NP delivery. e Quantitative analysis of NP biodistribution within the tumor and peripheral organs. Data are presented as mean values ± s.d. (n = 4 biological replicates, two-way ANOVA; ***p < 0.0001). f Quantitative flow cytometry results of avβ3 and avβ5 integrin expression in normal brain tissue and GL26 tumors. Data are presented as mean values ± s.d. (n = 5 biological replicates; two-tailed unpaired t-test; ****p < 0.0001).

