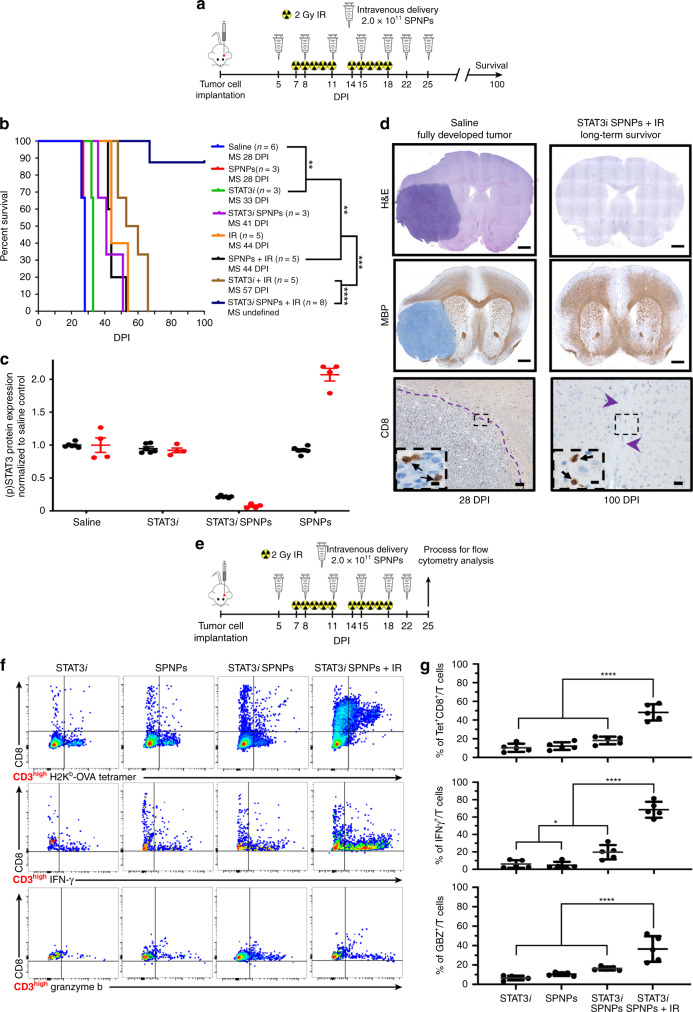
Fig. 3. STAT3i SPNPs + IR results in increased survival and primes an adaptive immune response.
a Timeline of treatment for the combined NP + IR survival study. b Kaplan–Meier survival curve. Significant increase in median survival is observed in all groups receiving IR. Mice (7/8) treated with STAT3i SPNPs + IR reach long-term survival timepoint (100 DPI) with no signs of residual tumor (Log-rank (Mantel-Cox) test; ****p < 0.0001, ***p < 0.001, **p < 0.01). c Quantified STAT3 expression for resected brains from the survival study, brains were collected when mice displayed signs of neurological deficits. A significant reduction is STAT3 (black) and pSTAT3 (red) expression was observed in the STAT3i SPNP cohort relative to untreated control. Both soluble STAT3i and empty SPNPs (with no siRNA) did not have high total STAT3 expression but they had increased levels of active phosphorylated STAT3 expression (pSTAT3). Data are presented as mean values ± s.d. relative to untreated control (n = 2 biological replicates for each group). Due to minimal biological samples available, three technical replicates were performed on each sample to validate the experimental protocol and rule out measurement error. d IHC staining for untreated control and STAT3i SPNP + IR long-term survivor. (Top) H&E staining shows the fully formed tumor in the saline control group (28 DPI). When treated with the combination of STAT3i SPNPs + IR, no tumor or signs of necrosis were observed. (Middle) MBP staining shows preserved brain structures with no apparent changes in oligodendrocyte integrity in mice that received STAT3i SPNPs + IR treatment compared to the saline control. Scale bars = 1 mm. (Bottom) CD8 staining shows no overt inflammation in mice that received STAT3i SPNPs + IR treatment compared to the saline control. Representative images from a single experiment consisting of three biological replicates per group are displayed. Scale bars = 100 µm (inset, 20 µm). e Timeline of TME immune population by flow cytometry. f Flow cytometry analysis of CD8 cells in the TME. Representative flow plots for each group are displayed. g Quantitative analysis of tumor-specific CD8+ T cells within the TME. GL26-OVA tumors were analyzed by staining for the SIINFEKL-Kb tetramer. Activation status of CD8+ T cells within the TME was analyzed by staining for granzyme B (Gzb) and IFNγ after stimulation with the tumor lysate. Data are presented as mean values ± s.d. (n = 5 biological replicates; one-way ANOVA and Tukey’s multiple comparison tests; ****p < 0.0001).

