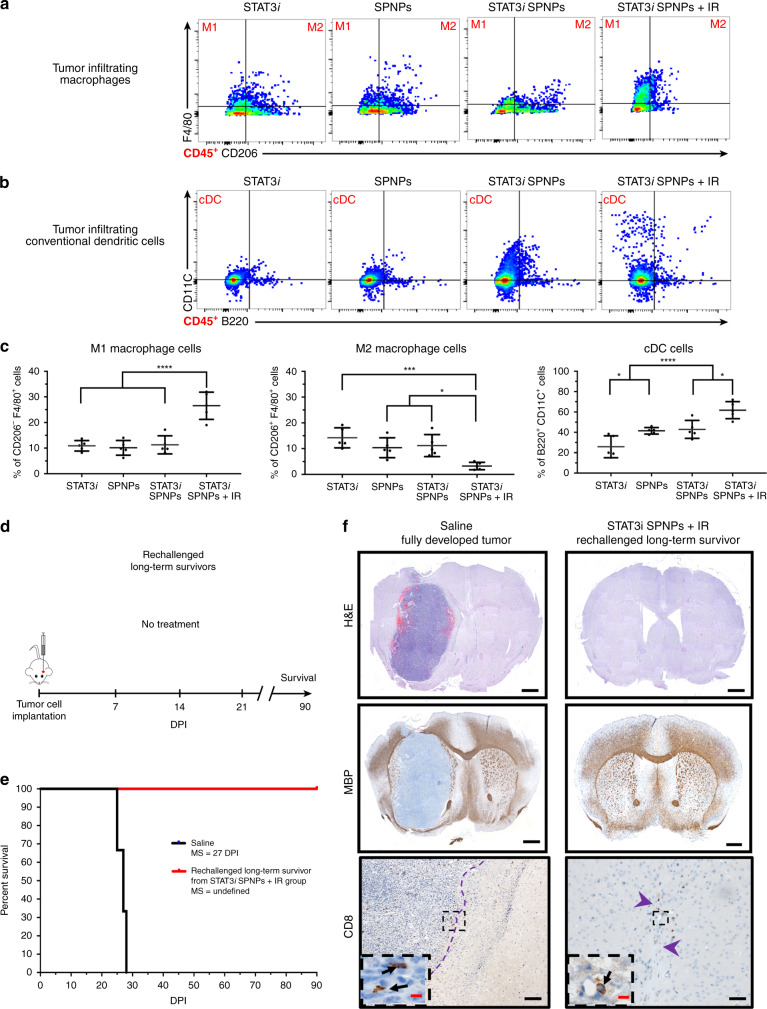
Fig. 5. SPNPs protect against GBM rechallenge.
a, b Flow analysis of tumor-infiltrating (a) macrophage and (b) conventional dendritic cell (cDCs) populations in the TME following NP + IR treatment regimen. Representative flow plots for each group are displayed. c Quantitative analysis of the immune cellular infiltrates showed a shift in the relative macrophage (M1vs. M2) present in the TME. In the free siRNA, empty SPNPs, and STAT3i SPNPs groups no significant change in the macrophage population were observed. Conversely, STAT3i SPNPs + IR treatment induces both a surge of ~2.5-fold increase in M1 population and a sharp 3- to 4-fold decrease in M2 macrophages. Among cDCs, progressively larger numbers of the cell population were observed moving from free siRNA to SPNPs groups. The combined treatment of STAT3i SPNPs with IR displayed the highest number of cDCs in the brain TME. Data are presented as mean values ± s.d. (= 5 biological replicates; one-way ANOVA and Tukey’s multiple comparison tests; ****p < 0.0001, ***p < 0.001, *p (M2) = 0.028, 0.013, *p(cDC) = 0.038, 0.011). d Timeline for rechallenging the long-term survivor for STAT3i SPNPs + IR survival study rechallenged, where following tumor implantation, no further treatment was provided. e Kaplan–Meier survival curve shows all rechallenged survivors reach a second long-term survival timepoint of 90 DPI in the absence of any therapeutic interventions. f H&E (Top, Scale bars = 1 mm), MBP (Middle, Scale bars = 1 mm), and CD8 (Bottom, Scale bars, 100 µm (inset 20 µm)) IHC staining comparing the brains of untreated and rechallenged long-term survivors. Representative images from a single experiment consisting of three biological replicates per group are displayed. No overt signs of remaining tumor, necrosis, inflammation, or disruption of normal brain architecture was observed in rechallenged long-term survivors from STAT3i SPNPs treatment group.

