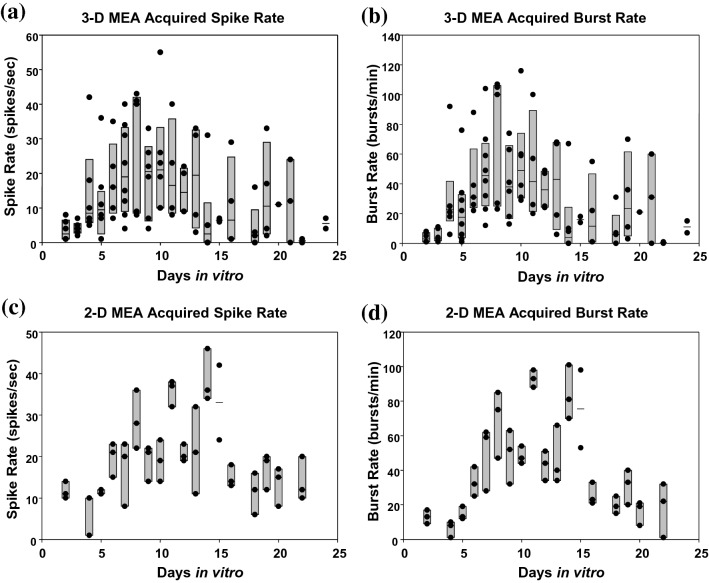
Fig. 3.
The development of electrophysiological activity in 3-D neural co-cultures in terms of spike and burst rates with respect to days in vitro recorded via spiked (3-D) MEAs (a and b) and planar (2-D) MEAs (c and d), respectively. The spike and burst rate values and development trends were similar in both spiked and planar MEA recordings for these 3-D neural co-cultures. The gray boxes show the 95% confidence interval at each time point (day 15 only had 2 cultures sampled), and each dark circle indicates activity of a unique culture. As a common trend, the spike and the burst rates increased rapidly in the first week in culture, maximized during the second week (suggesting a homeostatic process or saturation) and gradually dropped in the third week. The burst rate distribution is similar in trend to the spike rate distribution mainly because a majority of spikes lie within bursts

