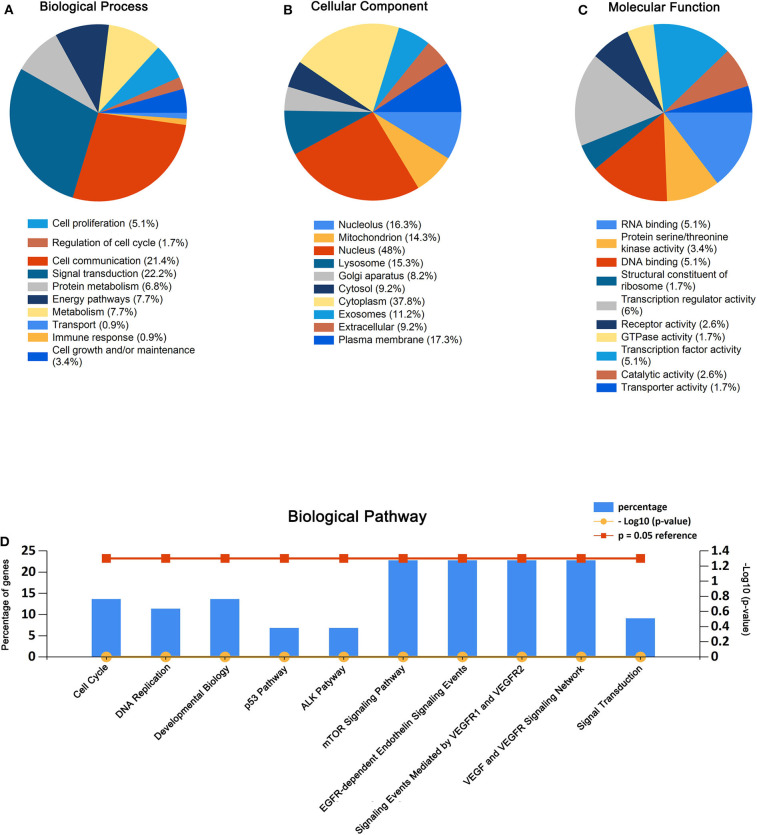
Figure 2.
GO enrichment analysis and pathway enrichment analysis for the predicted target genes of miR-550a-5p and miR-4661-3p. (A–C) Enriched biological process, cellular component, and molecular function of the target genes. (D) Pathway enrichment analysis of the target genes. The blue bars represent percentage of the target genes, and the red line and the yellow line represent P-value (0.05) and –log10 (P-value), respectively.

