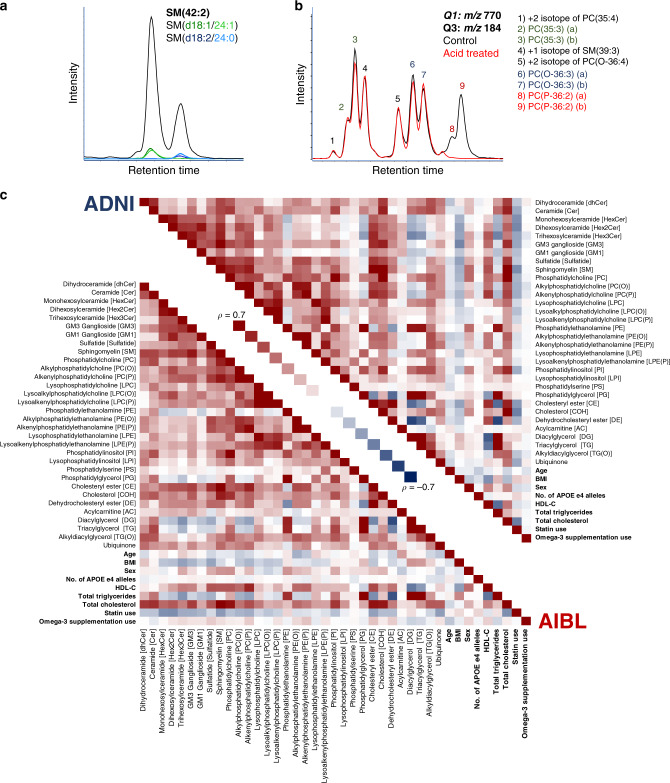
Fig. 1. Characterisation of lipid isomeric species and the relationship of lipid classes and subclasses within the AIBL and ADNI cohorts.
a Characterisation of sphingomyelin isomers. Black trace corresponds to the chromatogram seen under normal conditions. Additional experimental results in the green and blue traces used for identification, corresponding to SM(d18:1/24:1) and SM(d18:2/24:0) respectively. b Characterisation of glycerophospholipid isomers. Black trace corresponds to the chromatogram seen under normal conditions. Red trace is the same scan after sample acid hydrolysis. c Spearman correlation of total lipid classes, subclasses and commonly reported clinical measures (bolded) for the AIBL baseline and ADNI studies.

