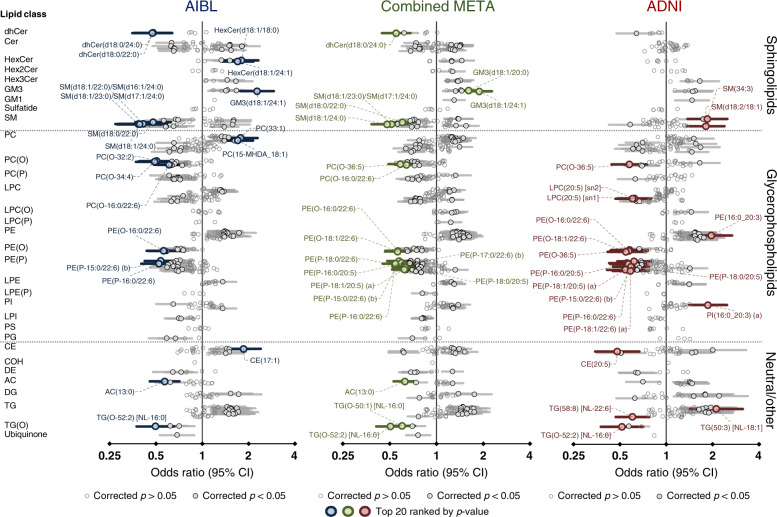
Fig. 3. Associations of individual lipid species with prevalent Alzheimer’s disease.
Forest plot outlining the logistic regression results of individual species, between controls and prevalent AD in both the AIBL (blue n = 268 cases, 696 controls) and ADNI (red, n = 178 cases, 210 controls) cohorts with the combined meta-analysis in the middle (green). P value was corrected for multiple comparison using approach by Benjamini and Hochberg. Covariates include age, sex, BMI, total cholesterol, HDL-C, triglycerides, number of APOE4 alleles, statin use and omega-3 supplementation. Additional covariates for AIBL include site of blood collection and time point while ADNI includes fasting status. Open circles, not significant; closed dark circles, significant after FDR correction; coloured circles, top 20 associations ranked by p value.

