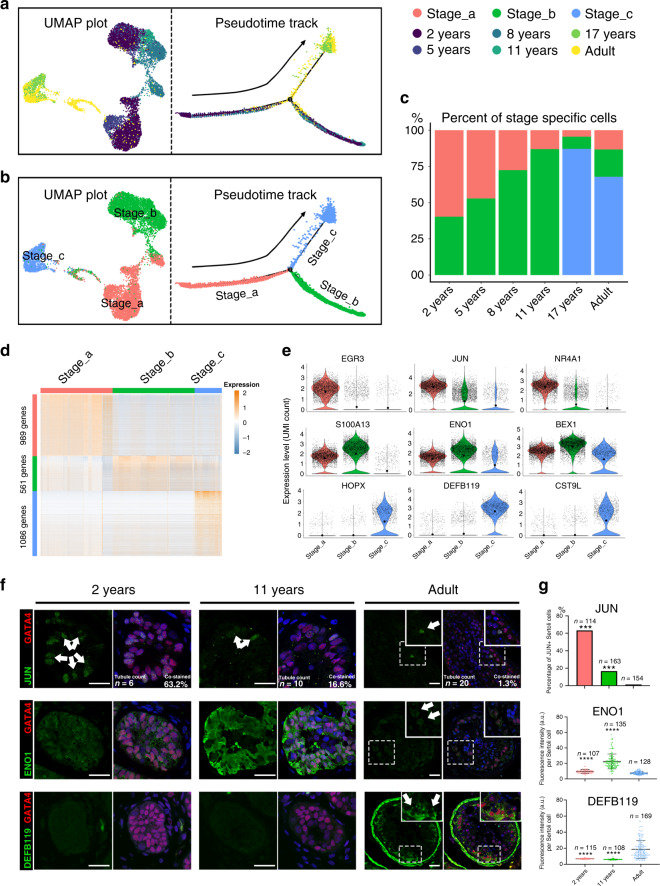
Fig. 2. Identification of three maturation stages during Sertoli cell development.
a, b Analysis of Sertoli cells (UMAP plot and pseudotime trajectory plot), with cells colored by a age or b stage. c Bar plot showing the proportion of Sertoli cells at each stage (Stage_a, red; Stage_b, green; Stage_c, blue) in each age group. d Heatmap showing the DEGs of each stage during Sertoli cell maturation. DEG counts are shown on the left of the color bar of the cell type annotation. e Violin plot showing the expression levels of the top DEGs at each stage (Stage_a, red column; Stage_b, green column; Stage_c, blue column). The larger black dots in each violin plot column represent the mean value. f Immunofluorescence co-staining of GATA4 (red) with JUN (green, upper panel), ENO1 (green, middle panel), and DEFB119 (green, lower panel) in human testicular paraffin sections at three ages. The scale bar represents 20 μm. ***p < 0.001. (comparing with normal adult). g The statistics of the percentage of JUN+ Sertoli cells (JUN+ /GATA4+ co-staining cells), and the fluorescence intensity of ENO1 and DEFB119 per Sertoli cell (GATA4+ cells). The percentage of JUN+ Sertoli cells in adult testis was significantly lower than that in 2 years (p = 0.0002) and 11 years (p = 0.0003); the fluorescence intensity of ENO1 per Sertoli cell in adult was significantly lower than that in 2 years (p = 2.3E-06) and 11 years (p = 4.7E−08); the fluorescence intensity of DEFB119 per Sertoli cell in adult testis was significantly higher than that in 2 years (p = 1.6E−09) and 11 years (p = 6.2E−08). In the upper panel (JUN), data shown as barplot of the percentage of JUN+ Sertoli cells in three age based on 5 fields, statistical analysis made by chi-square test; in the middle and bottom panel (ENO1 and DEFB119), data shown as mean ± SD, statistical analysis between fluorescence intensity per Sertoli cell in adult testis and immature testis made by two-tailed, unpaired non-parametric test with Mann–Whitney test; the confidence interval is 95%. ***p < 0.001, ****p < 0.0001 (comparing with normal adult).

