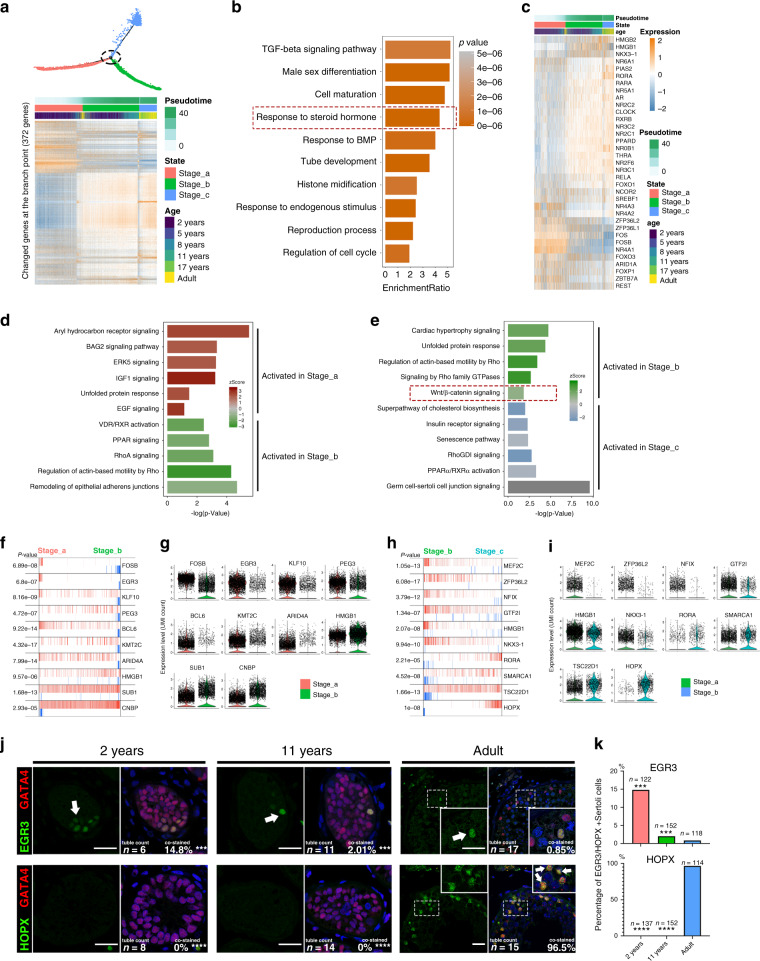
Fig. 3. Inferred signal pathways and master regulators for three stages of Sertoli cells.
a Heatmap of 372 genes that exhibited dramatic changes in gene expression at the intersection of two consecutive stages of Sertoli cell development. b Pathways and biological process terms of GSEA are shown as barplot. The GSEA score is presented on the x-axis, and the gradient of orange indicates low to high FDR values. c Heatmap of 37 genes related to the GO term “response to steroid hormone.” d, e Pathway terms of IPA enriched at each stage are shown as barplot. The P-value is presented on the x-axis, and the gradient of two colors indicates low to high activation scores in the two stages. f–h The top 10 candidate master regulators at each stage of Sertoli cell development identified by the master regulator analysis algorithm (MARINa) and g, i violin plots of the expression levels of those regulators in two consecutive stages. In the MARINa plots, activated targets are colored red and repressed targets are colored blue for each potential master regulator (vertical lines on the x-axis). On the x-axis, genes were rank-sorted by their differential expression in two consecutive developmental stages. The p values on the left indicate the significance of enrichment, calculated by permutating two developmental phases. j Immunofluorescence co-staining of GATA4 (red) with a master regulator of Stage_a, EGR3 (green, upper panel), and a master regulator of Stage_c, HOPX (green, lower panel), in human testicular paraffin sections at three ages. The scale bar represents 20 μm. (comparing with normal adult). k The statistics of the percentage of EGR3+ (upper panel) or HOPX+ (lower panel) Sertoli cells. The percentage of EGR3+ Sertoli cells in adult testis was significantly lower than that in 2 years (p = 0.0002) and 11 years (p = 0.0004), and the percentage of HOPX+ Sertoli cells in adult testis was significantly lower than that in 2 years (p = 3.53E−07) and 11 years (p = 7.11E−06). Data shown as barplot of the percentage of EGR3+ or HOPX+ Sertoli cells in three age based on 5 fields, statistical analysis made by chi-square test (according to the number of staining positive and negative cells); the confidence interval is 95%. ***p < 0.001, ****p < 0.0001 (comparing with normal adult).

