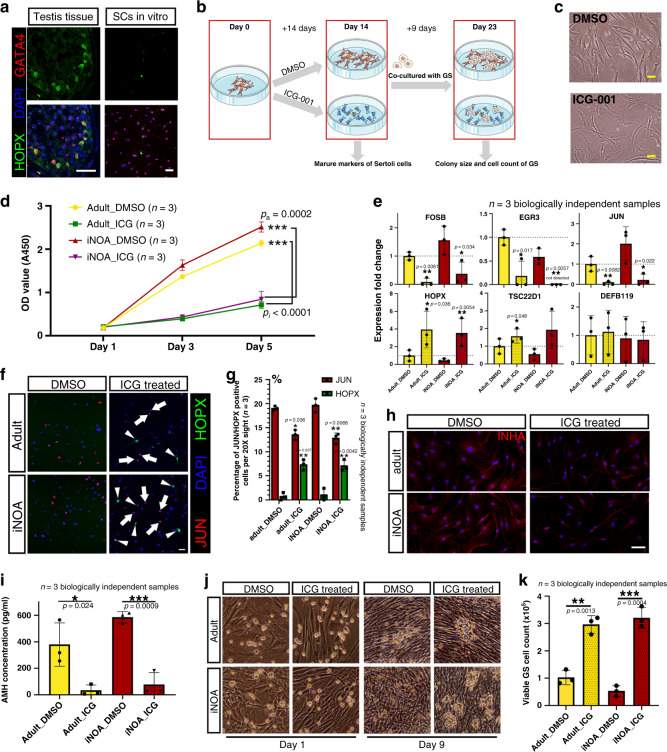
Fig. 6. Inhibition of the Wnt pathway induced the maturation of Sertoli cells in vitro.
a Immunofluorescence co-staining of GATA4 (red) and HOPX (green) in normal and pathological testicular paraffin sections and cultured Sertoli cells. The scale bar represents 40 μm. b Schematic illustration of the Wnt pathway inhibition experiment. c The morphology of cultured Sertoli cells with or without ICG treatment. The scale bar represents 20 μm. d Sertoli cells treated with ICG proliferated faster than DMSO-treated controls in vitro, as indicated by CCK-8 assay. Data shown as mean ± SD from three biologically independent samples and two times independent experiments, statistical analysis made by two-tailed, Student’s t-test; the confidence interval is 95%. ***p < 0.001 (comparing with normal adult). e qPCR results showing the expression fold change of six stage-specific markers in cultured iNOA and normal adult Sertoli cells with or without ICG treatment. The gene expression levels of normal adult Sertoli cells without ICG treatment (DMSO treated) were used as the baseline values. Data shown as mean ± SD from three biological independent samples. Statistical analysis made by two-tailed, unpaired Student’s t-test; the confidence interval is 95%. *p < 0.05, **p < 0.01, ***p < 0.001 (comparing with normal adult). f, g Immunofluorescence co-staining of JUN (red) and HOPX (green) in cultured iNOA and normal adult Sertoli cells with or without ICG treatment (f). The scale bar represents 20 μm. The statistics of JUN/HOPX positive cells count is shown as histogram (g). Data shown as mean ± SD from three 20X sights. This experiment was repeated two times independently with similar results. Statistical analysis made by two-tailed, unpaired Student’s t-test; the confidence interval is 95%. *p < 0.05, **p < 0.01, ***p < 0.001 (comparing with DMSO treated group). h Immunofluorescence of INHA (red) in cultured iNOA and normal adult Sertoli cells with or without ICG treatment. The scale bar represents 20 μm. i ELISA results showing the difference in AMH concentration in the supernatant of cultured iNOA and normal adult Sertoli cells with or without ICG treatment. Data shown as mean ± SD from three independent samples. Statistical analysis between ICG and DMSO treatment group made by two-tailed, unpaired Student’s t-test; the confidence interval is 95%. *p < 0.05; ***p < 0.001 (comparing with DMSO treatment group). j, k The morphology of cultured GS cell colonies when normal adult or iNOA Sertoli cells with or without ICG treatment are used as feeder cells (j). The statistics of viable GS cells count is shown as histogram (k). Images were taken with a ×20 magnification microscope. Data shown as mean ± SD from three independent samples. Statistical analysis between ICG and DMSO treatment group made by two-tailed, unpaired Student’s t-test; the confidence interval is 95%. **p < 0.01; ***p < 0.001 (comparing with DMSO treatment group).

