
Figure 4.
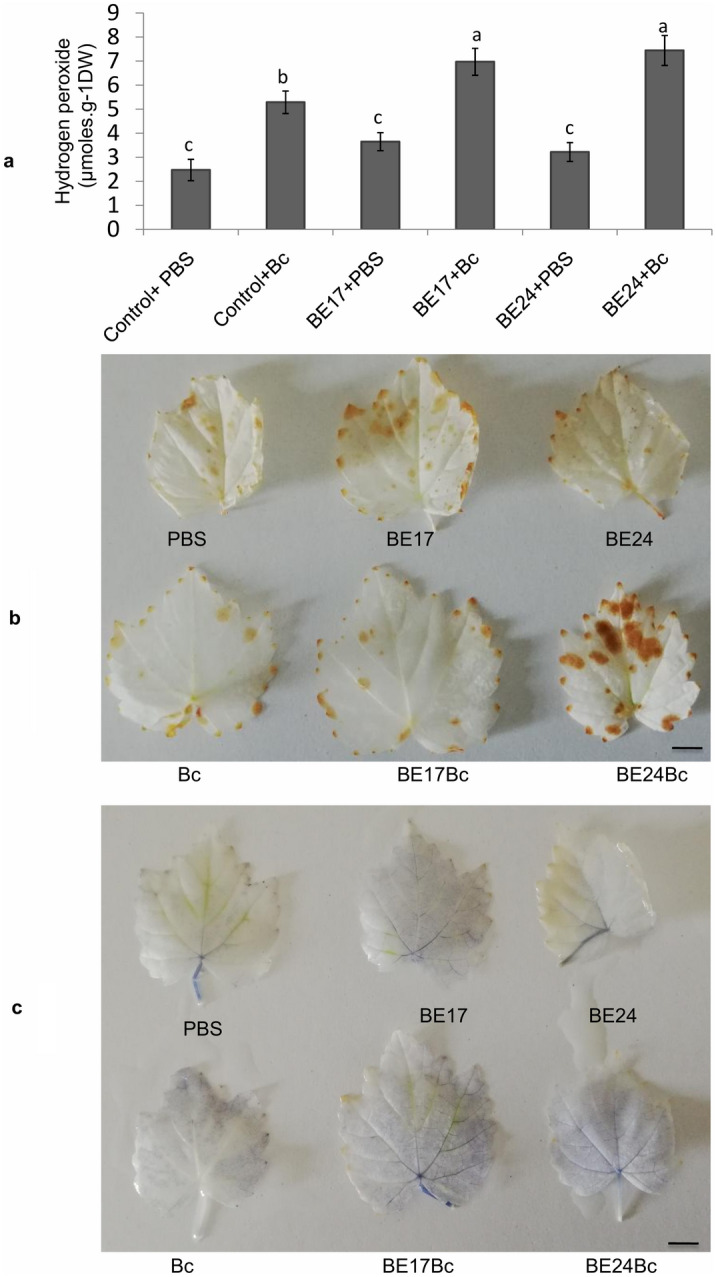
Accumulation of ROS in control and bacterized-plantlets after challenge with B. cinerea. (a) H2O2 content in control and bacteria-treated grapevine plantlets at 8hpi. Different letters indicate significant differences (P ≤ 0.05). (b,c) the histochemical detection of H2O2 and O2- in leaves of control and bacterized plantlets 8 hpi. PBS grapevine plantlets inoculated with PBS, Bc grapevine plantlets inoculated with PBS and infected by Botrytis, BE17 and BE24 plantlets inoculated with strain BE17 or BE24, Bc + BE17 and Bc + BE24 plants inoculated with strain BE17 or BE24 and infected by Botrytis. Values shown are means ± SD of three independent repetitions (each repetition was realized in triplicate). Bars = 5 mm.