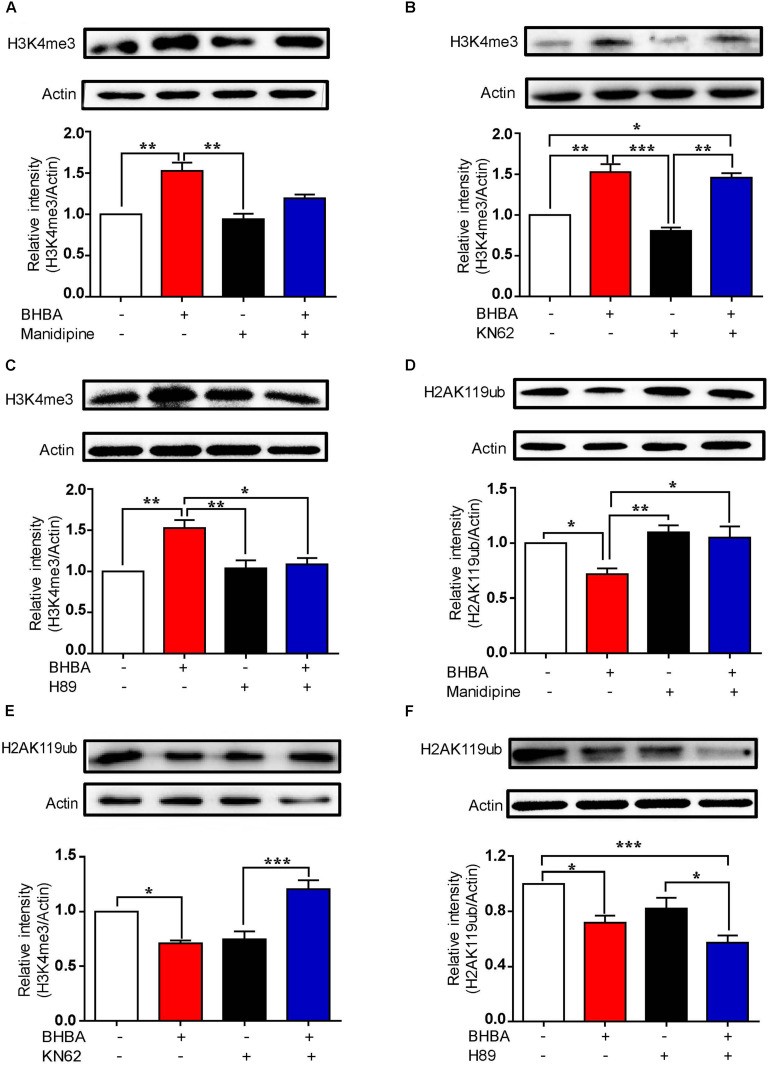
FIGURE 5.
The BHBA-induced changes of H3K4me3 and H2AK119ub depend on different signaling pathways. (A–C) Western blot analysis of H3K4me3 levels in hippocampal neurons treated with 10 μM manidipine (n = 3 or 4, F(3, 10) = 11.27) (A), 5 μM KN-62 (n = 3 or 4, F(3, 10) = 18.56) (B), or 10 μM H89 (n = 3 or 4, F(3, 11) = 10.84) (C) for 10 min or left untreated prior to treatment with 2 mM BHBA for another 1 h. (D, E) Western blot analysis for H2AK119ub levels in hippocampal neurons treated with 10 μM manidipine (n = 3 or 4, F(3, 10) = 1.898) (D), 5 μM KN-62 (n = 4, F(3, 12) = 16.95) (E), or 10 μM H89 (n = 4, F(3, 12) = 10.61) (F) for 10 min or left untreated prior to treatment with 2 mM BHBA for another 1 h. The data represent the mean ± SEM from three independent experiments. *p < 0.05, **p < 0.01, and ***p < 0.001.

