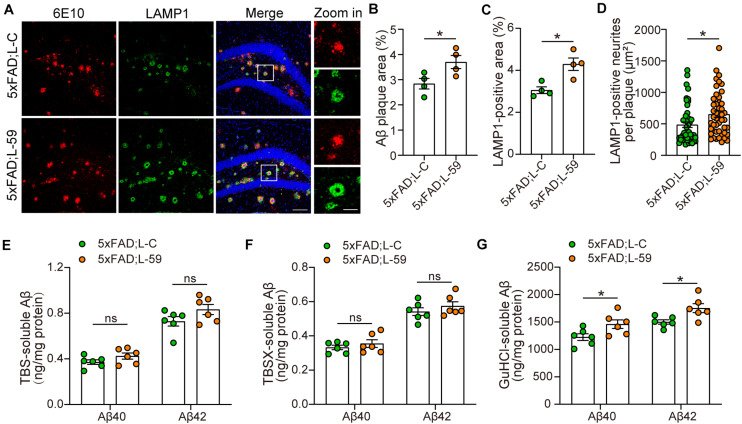
FIGURE 2.
Overexpression of TMEM59 exacerbates Aβ plaque deposition and neurite dystrophy in 5xFAD mice. (A) Z-stack confocal images of Aβ plaques (in red) and dystrophic neurites (indicated by LAMP1, in green) in the coronal sections from 6 to 7 month-old 5xFAD; L-C and 5xFAD; L-59 mice. Original magnifications are 20×, scale bar, 100 μm. Zoom-in images are on the right, scale bar, 30 μm. (B,C) Quantifications and comparisons of the total area of Aβ plaques (B) and LAMP1-positive dystrophic neurites (C) shown in (A). n = 4 mice per group. (D) Quantifications and comparisons of the area of Aβ-associated LAMP1-positive dystrophic neurites per plaque shown in (A). 48 plaques from four 5xFAD; L-C mice and 47 plaques from four 5xFAD; L-59 mice were studied for analysis. (E–G) The levels of Aβ40 and Aβ42 in the hippocampus of TBS-extractions (E), TBSX-extractions (F), and GuHCl-extractions (G) from 8 month-old 5xFAD; L-C and 5xFAD; L-59 mice were measured by ELISA and compared. n = 6 mice per group. Data represent mean ± SEM. *p < 0.05, ns: not significant. Unpaired t-test.

