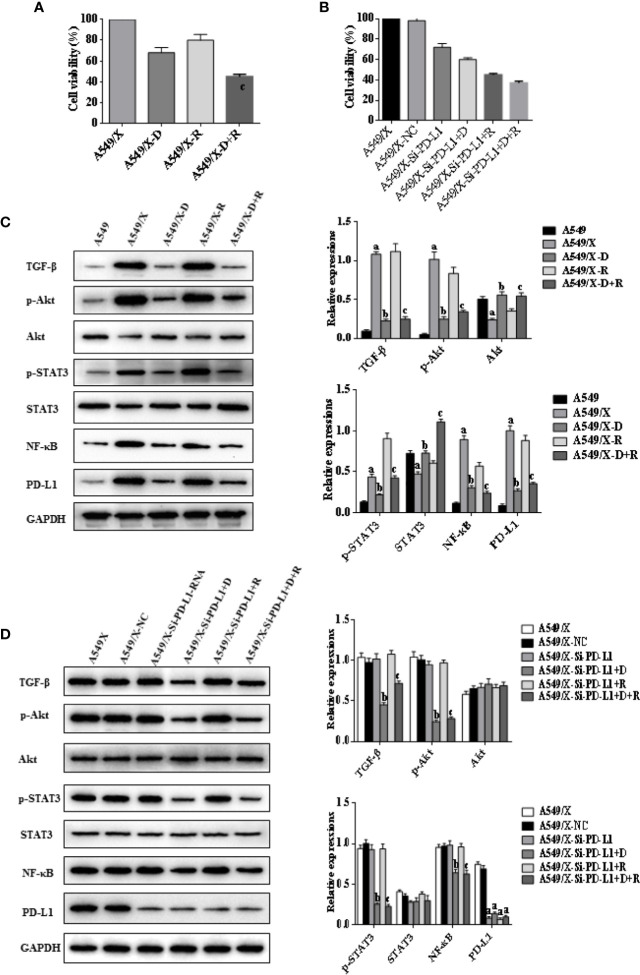
Figure 2.
Effects of radiotherapy and DHA on PD-L1, TGF-β, PI3K/Akt, and STAT3 signaling pathways in A549 and A549/X cells. (A) The MTT assay results of A549 and A549/X cell lines treated with vehicle, D, R, D+R. (B) The MTT assay results of A549/X-NC and A549/X-Si-PD-L1-RNA cell lines treated with vehicle, D, R, D+R. (C) The expressions of TGF-β, Akt, p-Akt, STAT3, p-STAT3, NF-κB, and PD-L1 in A549 and A549/X cell lines treated with vehicle, D, R, D+R by western blot. The values are expressed as means ± SEM. ap < 0.05 vs. the A549 group, bp<0.05 vs. the A549/X group, cp < 0.05 vs. the A549/X-R group; (D) The expressions of TGF-β, Akt, p-Akt, STAT3, p-STAT3, NF-κB, and PD-L1 in A549/X transfected with NC or PD-L1 siNRA while treated with vehicle, D, R, D+R by western blot. The values were expressed as means ± SEM. ap < 0.05 vs. the A549/X-NC group, bp < 0.05 vs. the A549/X-Si-PD-L1-RNA group, cp < 0.05 vs. the A549/X-Si-PD-L1-RNA+R group.

