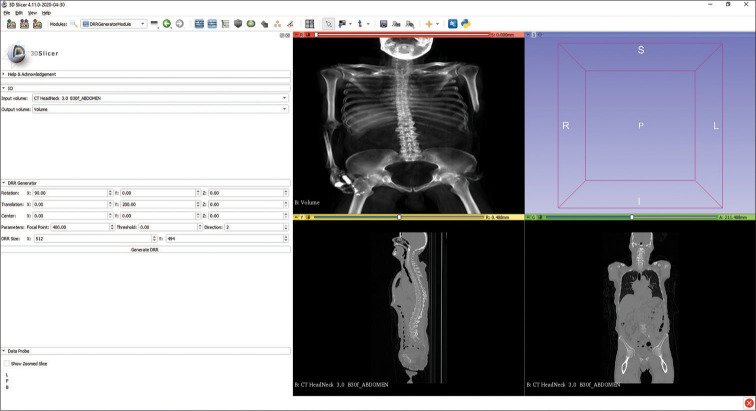
Figure 2:
An example of a digitally reconstructed radiograph (DRR) generation. The top left quadrant shows the DRR, the bottom quadrants show different views of a computed tomography image, and the top right quadrant shows where the data can be visualized in three-dimensional space. Window/level is set to differentiate bone by default, but can be modified within Slicer to change the contrast of the image. Noise can be added to further simulate a traditional radiograph.

