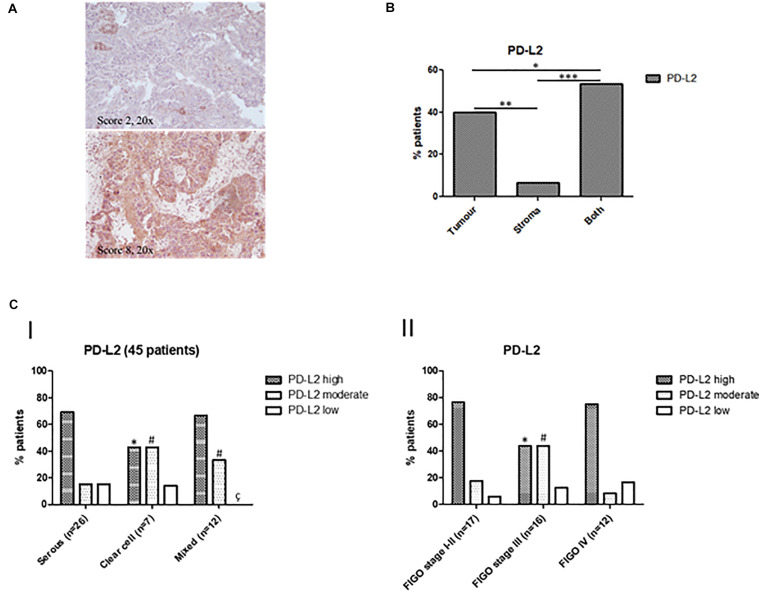
FIGURE 3.
(A) Representative images of IHC stainings for PD-L2 in human EC biopsies. Stainings and scores of representative tumors. Pictures were taken at ×20 magnification (scale bar, 50 μm). (B) Percentages of patients classified according to PD-L2 distribution inside tumoral mass. (C) Classification of patients according to PD-L2 expression and clinicopathological characteristics. (I) Percentages of patients classified according to PD-L2 expression in EC, *p < 0.05 vs serous type PD-L2high, #p < 0.05 vs serous type PD-L2moderate, çp < 0.05 vs serous type PD-L2low. (II) Percentage of patients classified according to PD-L2 expression and FIGO stage, *p < 0.05 vs FIGO stages I–II PD-L2high, #p < 0.05 vs FIGO stages I–II PD-L2moderate.

