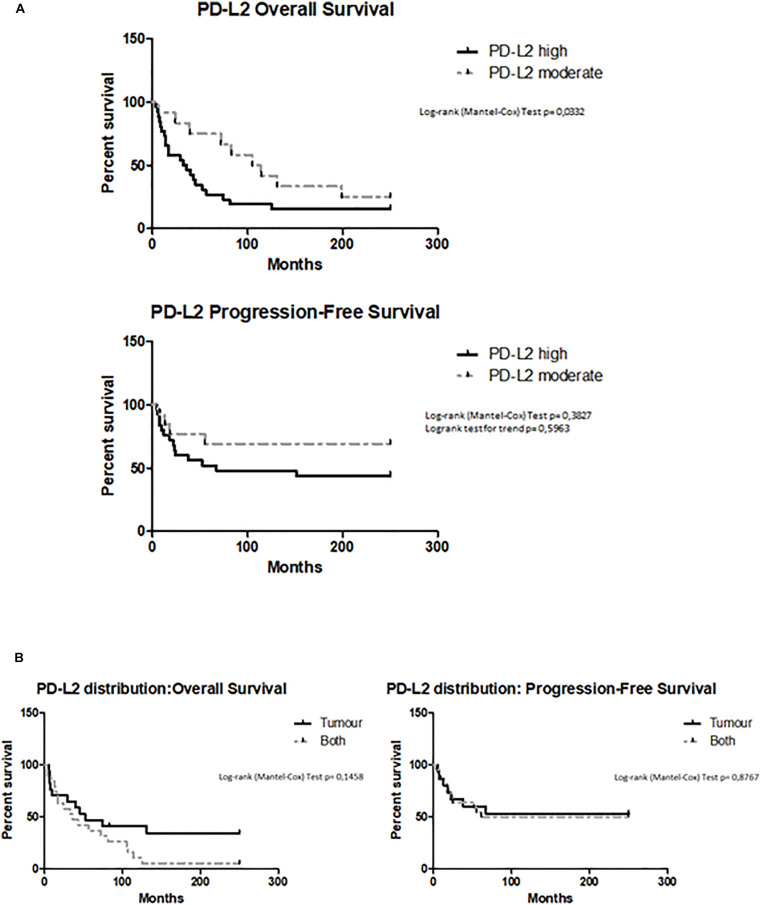
FIGURE 4.
(A) Survival of EC patients according to PD-L2 expression. Kaplan–Meier survival curves showing overall survival (OS) and PFS of EC patients. The log-rank test with corresponding p-values applies to the PD-L2high and PD-L2moderate curves. (B) Survival of EC patients according to the PD-L2 distribution. Kaplan–Meier survival curves showing OS and PFS of EC patients, according PD-L2 distribution inside tumoral mass (tumor, stroma, or both). The log-rank test with corresponding p-values applies to the PD-L2–tumor and PD-L2–both.

