Figure 3.
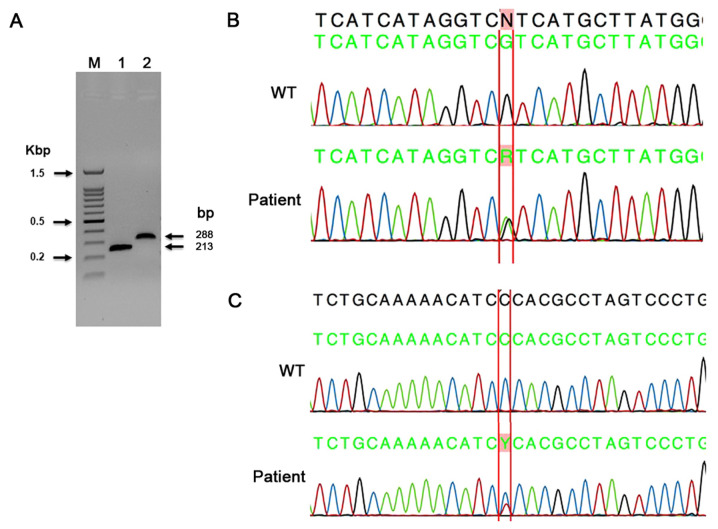
A representative PCR gel and electropherograms for IDH1 and IDH2 sequencing. (A) Representative image of gel IDH1 and IDH2 exon 4 PCR products Lane denoted as (M) is a 100 bp ladder. Lanes 1 and 2 are IDH1 and IDH2 PCR products showing 213 and 288 bp product size. (B) Representative electropherogram of a known missense mutation in IDH1 c.395G>A; p. (Arg132His). Upper sequence is WT, lower sequence is tumor sample. Letter ‘R’ represent nucleotide G changed to G/A heterozygous. (C) Representative electropherogram showing a novel missense mutation in IDH2 c.472C>T; p. (Pro158Ser). Upper sequence is WT, lower sequence is tumor sample. Letter ‘Y’ represents nucleotide C changed to T/C heterozygous. IDH, isocitrate dehydrogenase; WT, wild type.

