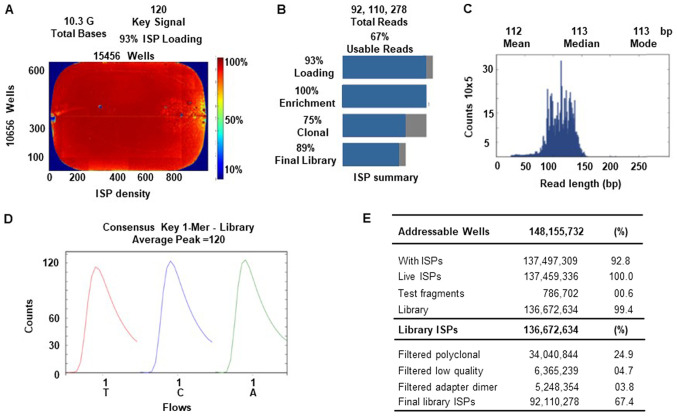
Figure 4.
Torrent Suite software generated Ion PI chip run report metrics. (A) The ISP density image is showing percent loading across the semi-conductor chip, key signal and total bases read. (B) ISP summary showing loading, enrichment, clonality and final library quality. (C) Read length histogram showing trimmed lengths of all reads in base pairs. (D) Key signal details. (E) Addressable wells, and library ISP details. ISP, ion sphere particle.

