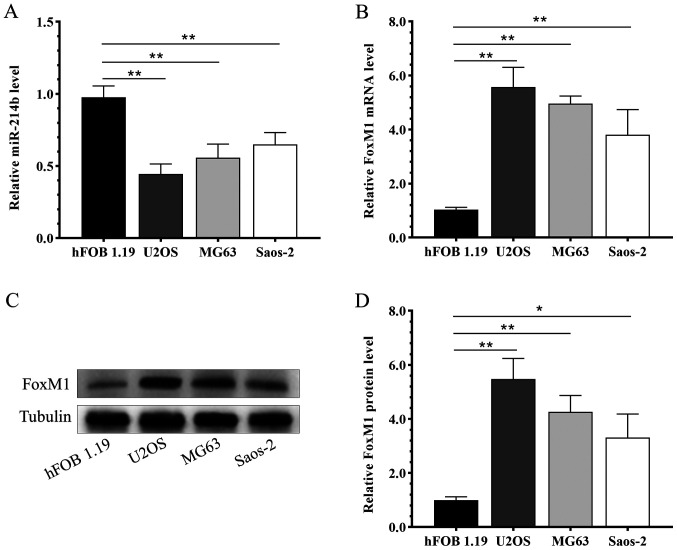
Figure 1.
Opposite expression patterns of FoxM1 and miR-216b in osteosarcoma cells. The expression level of (A) miR-216b and (B) FoxM1 mRNA in osteoblast and osteosarcoma cells. FoxM1 protein expression levels were (C) determined by western blotting and (D) semi-quantified. *P<0.05, **0.05≤P<0.01. FoxM1, forkhead box M1; miR, microRNA.

