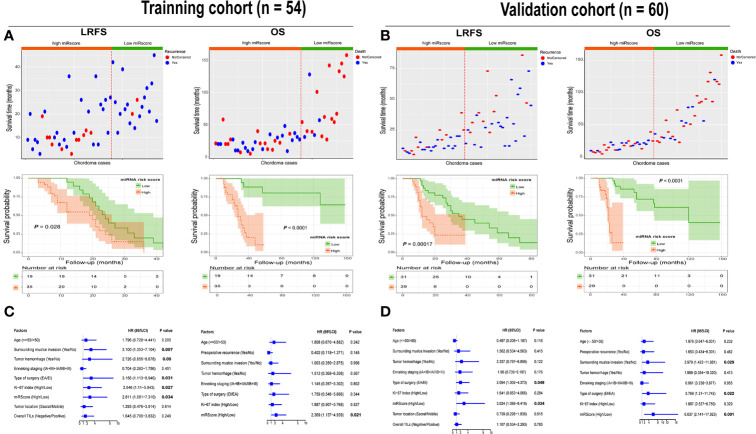
Figure 5.
(A) Distribution of recurrence and survival status in chordoma patients stratified by the miRscore data in the training cohort (top). Red dotted line represents the miRscore cutoff dividing patients into high and low groups. Kaplan-Meier curve of LRFS and OS according to low or high miRscore group (middle). (B) Distribution of recurrence and survival status in chordoma patients stratified by the miRscore data in the training cohort (top). Red dotted line represents the miRscore cutoff dividing patients into high and low groups. Kaplan-Meier curve of LRFS and OS according to low or high miRscore group (middle). (C) Multivariate Cox regression model for LRFS and OS of spinal chordoma patients in the training cohort. The boxes indicate the hazard ratio, and the horizontal lines represent 95% confidence intervals. (D) Multivariate Cox regression model for LRFS and OS of spinal chordoma patients in the validation cohort. miRscore, microRNA risk score; LRFS, local recurrence-free survival; OS, overall survival.

